
How to Use an Economic Calendar in Forex Trading
Every month, a handful of scheduled numbers move the currency market more than almost anything else: the US jobs report, inflation, central bank rate decisions. They are announced weeks in advance, to the minute. Yet many traders still get caught with an open position and a tight stop when one of them lands.
An economic calendar is the simple fix. This guide explains how to read one, which events matter most (we measured it on more than 20 years of market data), what actually happens around a release, the twice-yearly time-zone trap that catches automated systems, and how to decide whether to trade the news, avoid it or pause your Expert Advisor.
You can follow along with our free Economic Calendar, which shows 11 currencies and markets, impact ratings and actual figures in your local time.
Key takeaways
- An economic calendar lists scheduled data releases and central bank decisions, with their time, the previous figure and the actual figure when it is released.
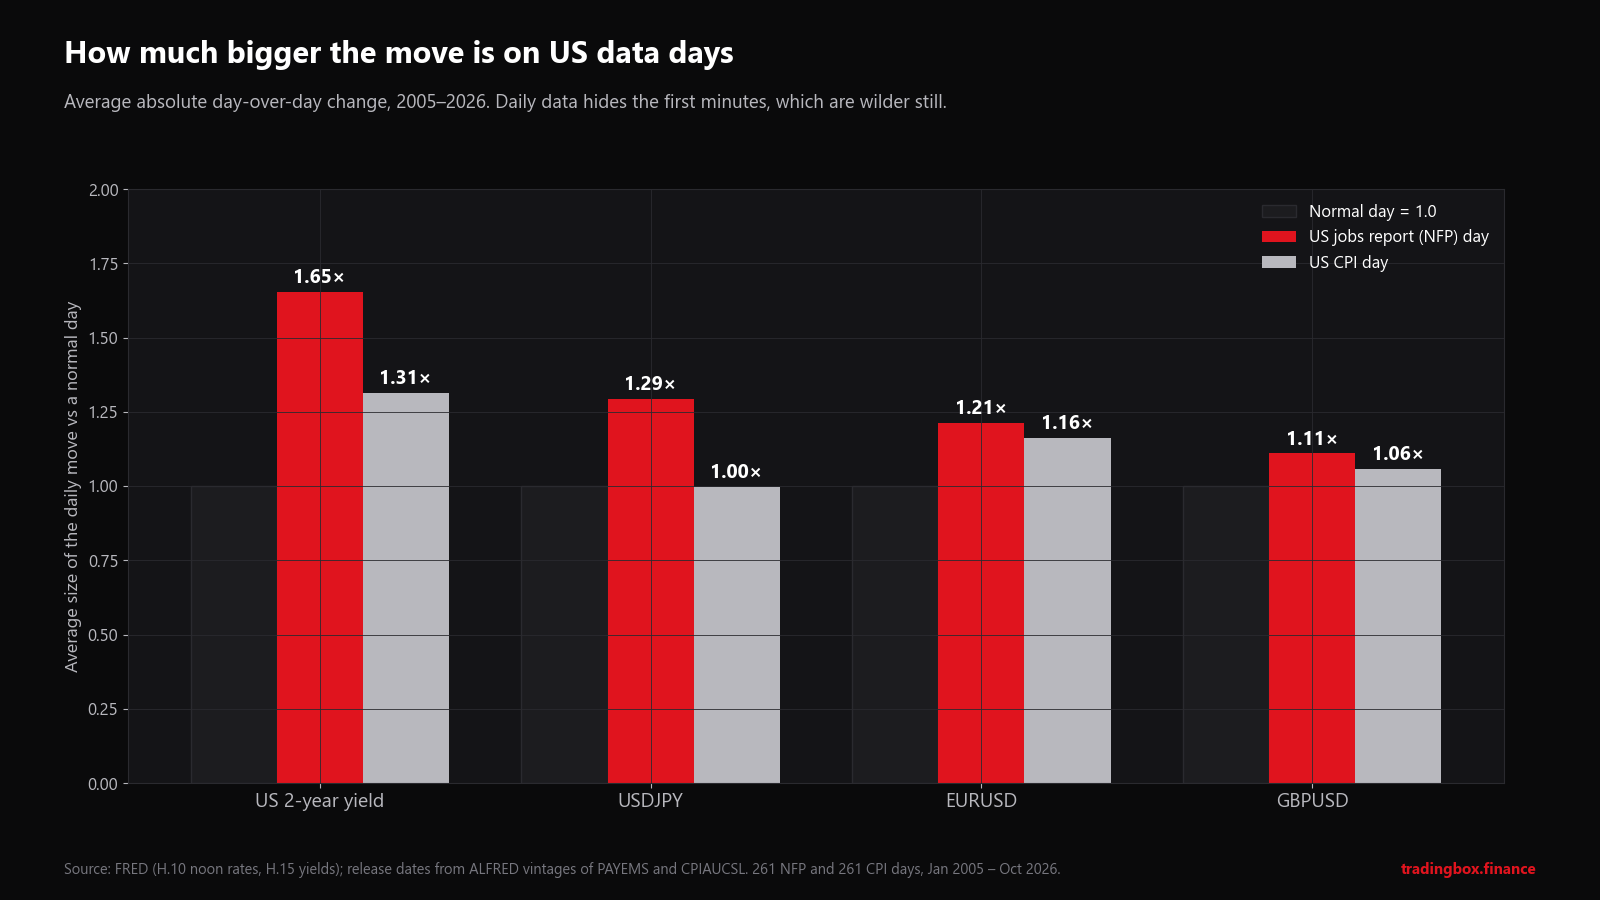
- On US jobs report days from 2005 to 2026, the US 2-year Treasury yield moved on average 1.65 times as much as on a normal day, USDJPY 1.29 times and EURUSD 1.21 times, and that is on daily data, which hides the wildest first minutes.
- Which report matters most changes over time: in 2022, when inflation was the problem, CPI days moved the 2-year yield 2.4 times as much as normal, far ahead of the jobs report.
- Around a release, spreads widen, prices can jump past stops, and the first move often reverses.
- Twice a year, US and European clocks change on different dates. In those weeks US releases arrive one hour earlier than usual in Europe and in countries that change their clocks on Europe's dates, and EAs with fixed "news hours" get it wrong.
What an economic calendar shows
| Column | What it means |
|---|---|
| Time | When the number is published. Make sure your calendar shows your own time zone. |
| Currency | The currency most directly affected (USD for US data, EUR for euro-area data...). |
| Impact | How closely traders usually watch it: High, Medium or Low. |
| Event | The release or decision, and the period it covers (for example CPI, September). |
| Actual | The published figure, shown once it is out. |
| Forecast | The average expectation of economists, where available. |
| Previous | The last figure, sometimes revised. |
Markets move on surprises, not on good or bad numbers. If everyone expects inflation of 3.1% and it comes in at 3.1%, there may be little movement even though inflation is high. If it comes in at 3.5%, the market has to reprice, fast. Our calendar also marks each released figure as positive or negative for its currency compared with the previous figure, as a quick guide.
The events that matter most
| Event | Who publishes it | Usual time | Why it moves markets |
|---|---|---|---|
| Non-Farm Payrolls (NFP) | US Bureau of Labor Statistics | 8:30 New York time, usually a Friday | Jobs, unemployment and wages in one report: the strongest signal for Fed policy |
| CPI | US Bureau of Labor Statistics | 8:30 New York time | Inflation, the Fed's main target |
| FOMC rate decision | US Federal Reserve | Statement 14:00, press conference 14:30 New York time | Sets US interest rates; the press conference can move markets as much as the decision |
| ECB rate decision | European Central Bank | 14:15, press conference 14:45 Frankfurt time | EUR pairs |
| BoE, BoJ, BoC, RBA, RBNZ, SNB decisions | Each central bank | Varies | The pairs of each currency |
| GDP | National statistics offices | Varies | Growth; usually smaller surprises because much is known in advance |
| Retail sales, PMIs, jobless claims | Various | Varies | Medium impact; can matter a lot when the market is focused on growth |
Our calendar has a page for each major release explaining what it measures and why traders watch it, for example Non-Farm Payrolls, US CPI, FOMC rate decision and ECB rate decision.
A note on NFP dates: it is often called "first Friday of the month", but the Bureau of Labor Statistics schedules it by a rule tied to the survey week, so it sometimes falls on the second Friday, and occasionally on another day after a holiday or a government shutdown. Always check the calendar rather than assuming. Our NFP day guide lists the 2026 dates and measures how much the market moves.
How much do these releases really move the market?
We measured it. Using the official release dates of every US jobs report and every CPI report since 2005 (the Federal Reserve's ALFRED archive records the exact day each figure was published) and daily market data from the Federal Reserve, we compared the average size of the daily move on release days with all other days.
| Jobs report (NFP) day | CPI day | |
|---|---|---|
| US 2-year Treasury yield | 1.65× | 1.31× |
| USDJPY | 1.29× | 1.00× |
| EURUSD | 1.21× | 1.16× |
| GBPUSD | 1.11× | 1.06× |
1.00× = the average normal day. 261 jobs-report days and 261 CPI days, January 2005 to October 2026.
Three things stand out:
- Interest rates react first and most. The 2-year yield, which tracks expectations for Fed policy, reacts most strongly. Currencies follow because rate expectations drive them.
- The effect is real but not enormous on daily data. These are noon-to-noon New York prices. The move in the first minutes after 8:30 is often much larger and partly reverses within the day, so a 1.3× daily average hides very sharp intraday swings. Anyone holding a tight stop experiences the intraday swing, not the daily average.
- Pairs with the dollar react more than crosses. GBPUSD reacted least of the four, because UK-specific news often matters more for sterling.
Which report matters most changes over time
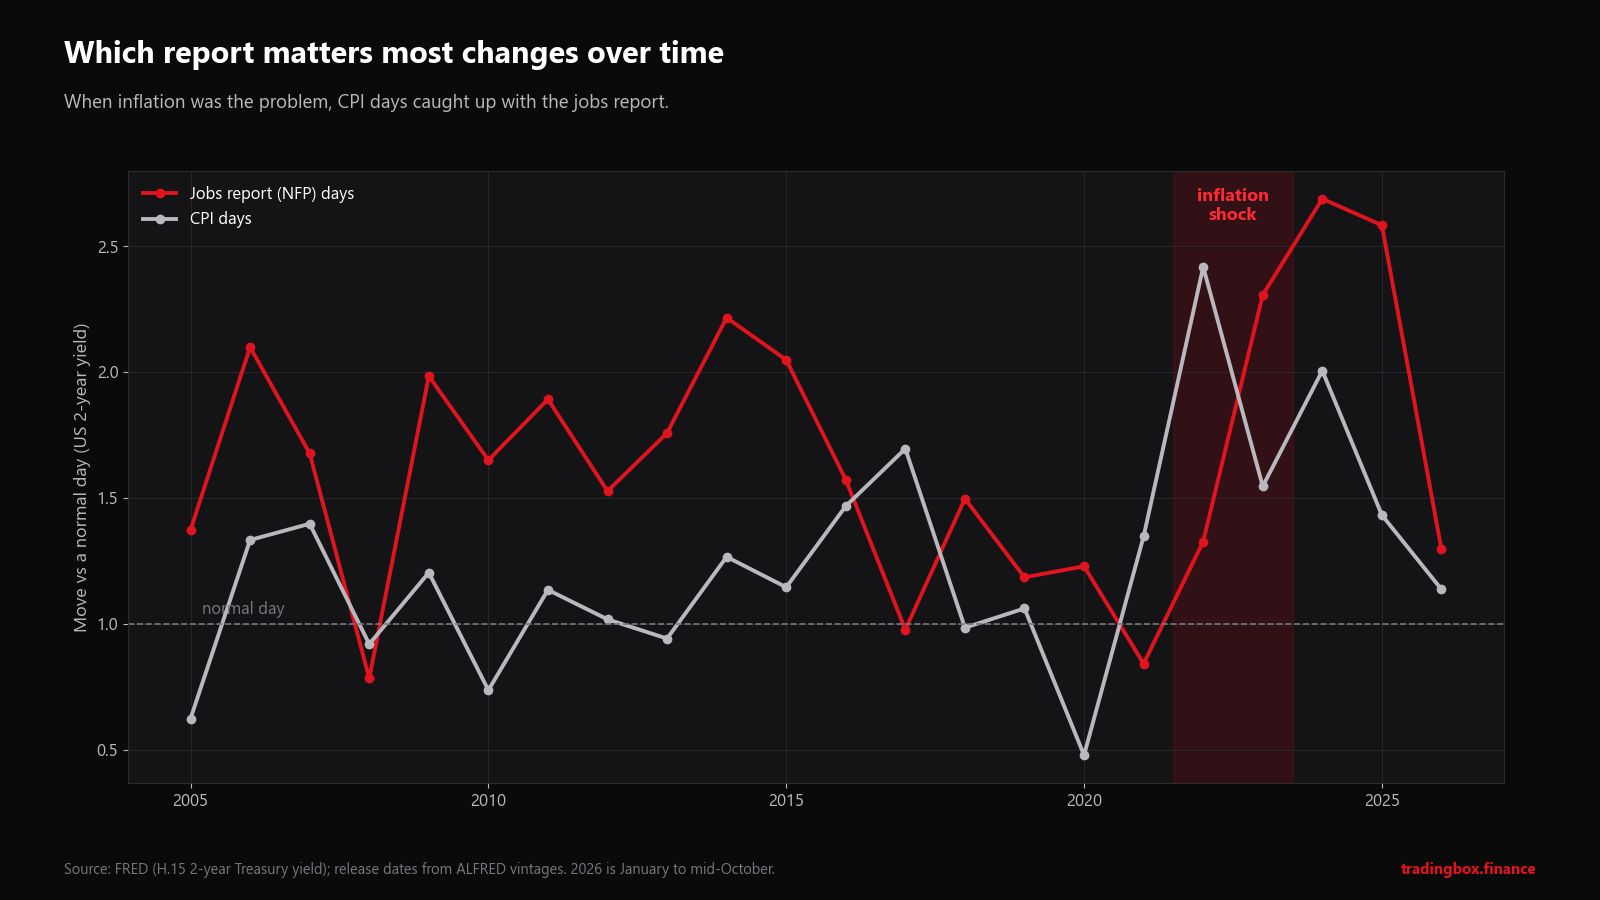
For most of the last 20 years the jobs report was the bigger event. But in 2022, when US inflation hit its highest level in four decades, CPI days moved the 2-year yield 2.4 times as much as a normal day, while jobs days were at 1.33×. Then in 2023–2025, as the market's focus shifted to whether the economy was slowing, the jobs report took over again, at up to 2.7× in 2024.
The lesson: impact ratings are not fixed. The release the market is most worried about this year is the one that moves it most. Read the news around the calendar, not just the calendar.
What happens around a high-impact release
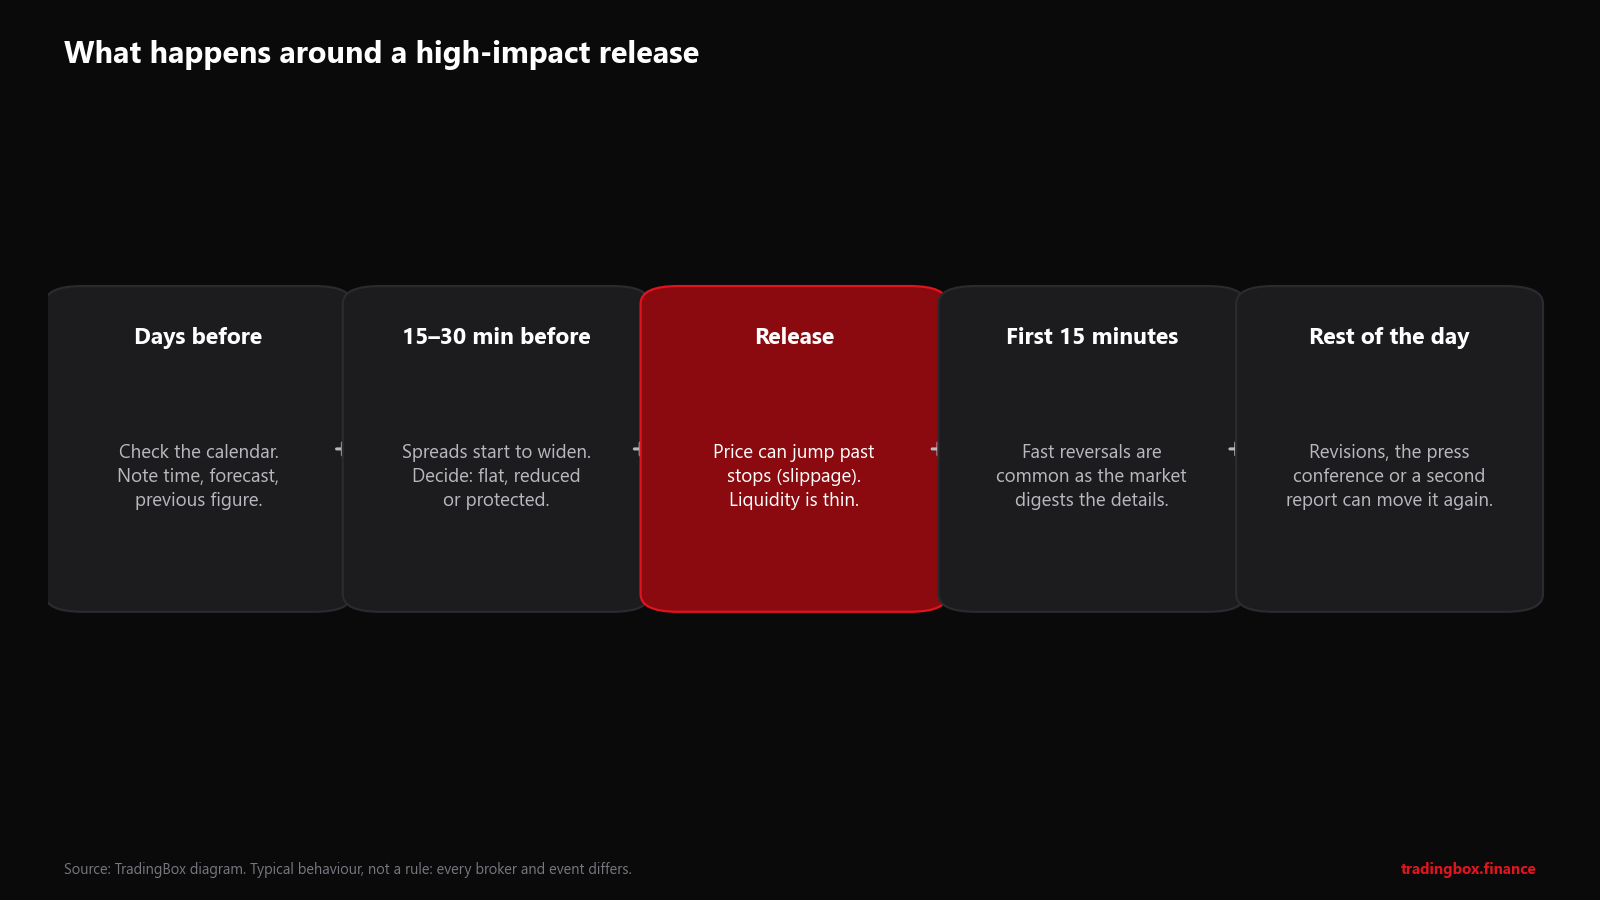
- Days before: the event appears on the calendar with the previous figure and expectations. Positioning builds.
- 15–30 minutes before: liquidity providers pull back. Spreads widen, sometimes several times their normal size.
- At the release: prices can jump rather than move. A stop loss becomes a market order once touched, and may be filled well past its level (slippage). Pending orders can be filled at a worse price.
- First 15 minutes: the first move often reverses as traders read the details (a strong jobs number with weak wages, revisions to previous months...).
- Rest of the day: a press conference, a second release or a speech can move the market again.
This behaviour is typical, not guaranteed. Every broker handles news differently; our article on A-book, B-book and C-book brokers explains why.
Three ways to handle the news
1. Stay out. Close or don't open positions shortly before high-impact events for your currencies, and wait until spreads normalise. The simplest choice and the right one for most beginners.
2. Stay in, protected. Keep longer-term positions but make sure the stop is far enough from the price that a normal news spike won't trigger it, and that the size is small enough that slippage won't hurt. Our position size guide shows how to keep the risk fixed when the stop is wider.
3. Trade the reaction. Some strategies trade the move after the release, once the spread is back to normal and the first spike has settled. Trading the exact second of the release is mostly a contest of speed and execution that retail traders rarely win.
Whatever you choose, decide it before the release, not while the price is jumping.
Should you pause your EA during news?
It depends on what the Expert Advisor does.
Pause it (or use a news filter) if the EA:
- uses tight stops or targets (scalping, a few pips),
- opens pending orders close to the price,
- uses grid or martingale logic that adds trades as the price moves against it,
- was never backtested through news spikes with realistic spreads.
It may be fine to leave it running if the EA:
- trades higher timeframes with wide stops,
- was tested on real tick data that includes news periods,
- already limits trading when the spread is above a set level.
A good news filter inside an EA does three things: it reads the event times from a reliable calendar (in UTC, so time zones can't confuse it), it stops opening new trades a set number of minutes before and after high-impact events for the relevant currencies, and it refuses to trade while the spread is above a limit. Building one in is a common request in our custom EA development work.
The daylight-saving trap
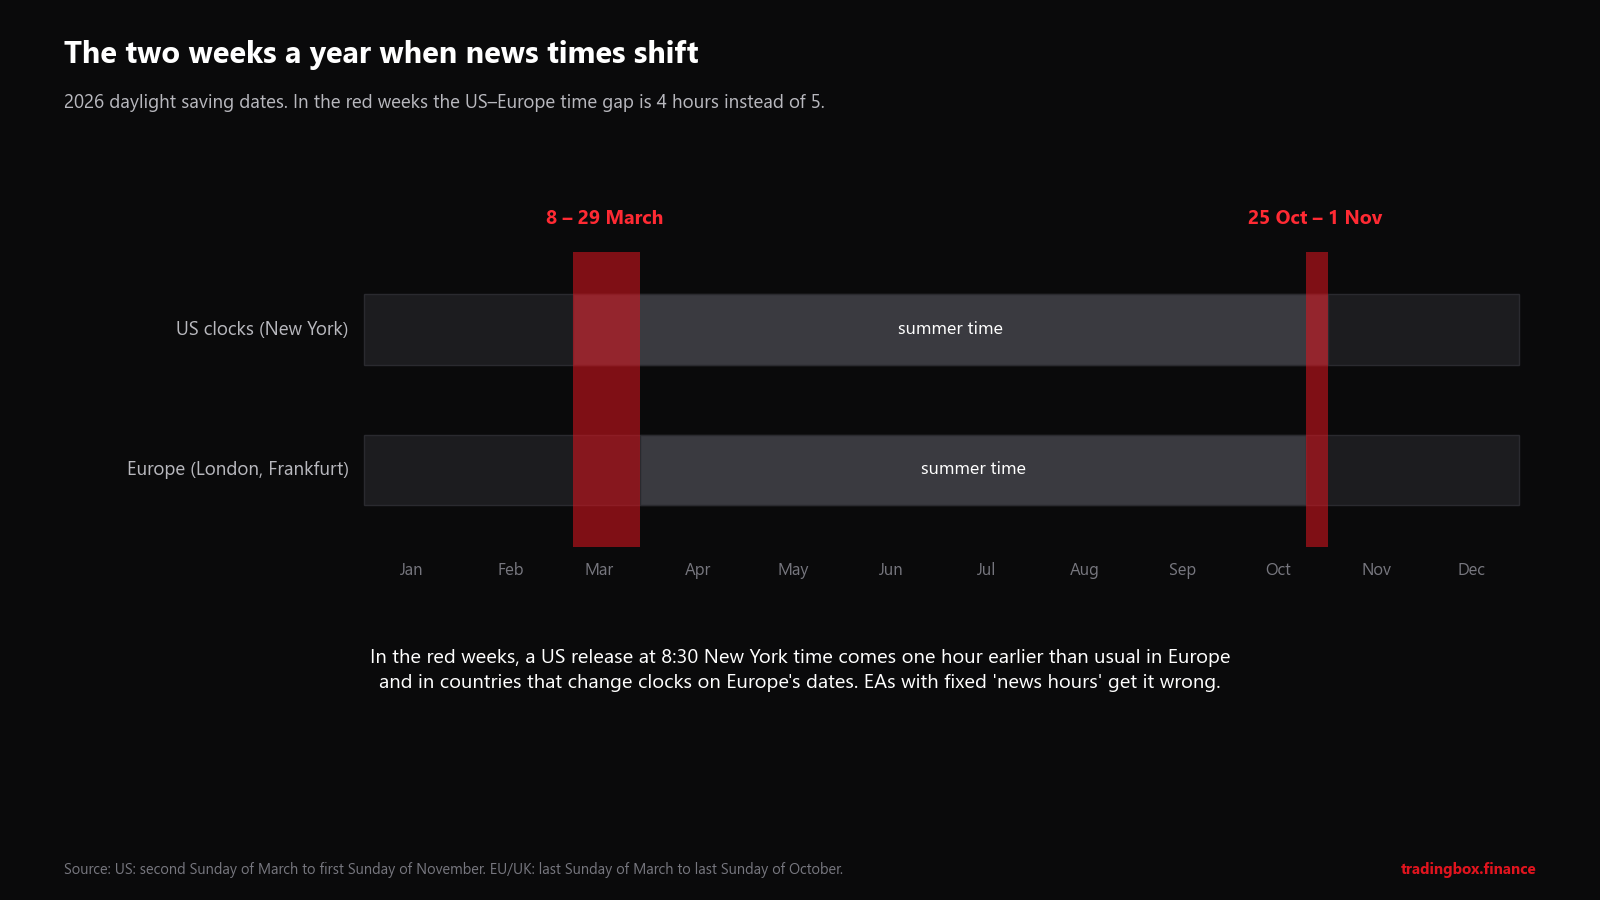
The United States moves its clocks on the second Sunday of March and the first Sunday of November. The European Union and the UK move theirs on the last Sunday of March and the last Sunday of October. In 2026, that leaves two gaps: 8 to 29 March and 25 October to 1 November.
During those weeks, the gap between New York and London is 4 hours instead of 5. A US release at 8:30 New York time, normally 13:30 in London, arrives at 12:30 instead. The same happens in any country that changes its clocks on Europe's dates. In countries with no clock change at all, such as the United Arab Emirates, US releases move one hour on the US dates instead (8 March and 1 November in 2026). Either way, the time on your screen changes at least once in spring and once in autumn.
Who gets caught:
- traders with a fixed habit ("NFP is always at 3:30 my time"),
- EAs with hard-coded news hours or trading sessions,
- broker server time, which many brokers shift with US daylight saving so that the daily candle closes at 17:00 New York time, so your chart time may move on a different date from your own clock.
The fix: work in UTC or use a calendar that converts to your local time for you, as ours does, and make sure any EA's time logic is based on UTC, not on fixed local hours.
How to use the calendar every week
- Sunday or Monday: open the calendar, filter to High impact and the currencies you trade, and note the times.
- Before each trade: check what is due during the time you expect to hold it.
- On release days: decide in advance: flat, protected or trading the reaction.
- After the release: compare the actual figure with expectations and watch how the market reacts. Over time you learn what the market currently cares about.
- Twice a year: double-check times in the daylight-saving weeks.
Frequently asked questions
What is the most important economic release for forex? Over the last 20 years, the US jobs report (NFP) has moved US rates and the dollar most consistently, followed by CPI and the Fed's rate decisions. But the ranking changes with what the market is worried about, as 2022 showed.
Why does gold move on US data? Gold is priced in US dollars and competes with interest-bearing assets. Data that raises expected US interest rates tends to strengthen the dollar and weigh on gold, and the other way round. Our article on gold and the US dollar measures that relationship over 50 years.
Why did the market go up on bad news? Because what matters is the surprise compared with expectations, and what the market thinks the central bank will do next. Weak data can lift stocks or a currency if it makes rate cuts more likely or less severe than feared.
Is trading the news a good strategy? Trading the instant of the release is mostly about speed, spreads and slippage, which favour large, fast participants. Some traders do well trading the slower reaction afterwards. Many simply avoid it.
Do I need a paid calendar? No. Free calendars, including ours, show the times and the actual figures. What matters is using one consistently.
Next steps
- Open the free Economic Calendar, filter to the currencies you trade and set it to your local time.
- Size trades for wider stops on news days with the free Lot Size Calculator.
- Running an EA? Ask us about adding a news filter and spread limit: custom EA development.
Sources
- Market data: Federal Reserve Board H.10 noon buying rates (USDJPY, EURUSD, GBPUSD) and H.15 2-year Treasury yield, via FRED. Release dates: ALFRED vintage dates of the series PAYEMS (Employment Situation) and CPIAUCSL (CPI). Calculations: TradingBox, January 2005 to mid-October 2026.
- U.S. Bureau of Labor Statistics: 2026 release schedule (Employment Situation at 8:30 a.m. Eastern).
- Federal Reserve: time of FOMC statements and press conferences.
- European Central Bank: press conferences (decision 14:15 CET, press conference 14:45 CET).
This article is education, not financial advice. Past market reactions do not predict future ones. Trading around news carries a high risk of loss, including slippage beyond your stop.
Trading involves risk. See the risk disclaimer.