
Gold vs the US Dollar: 50 Years of Correlation Data
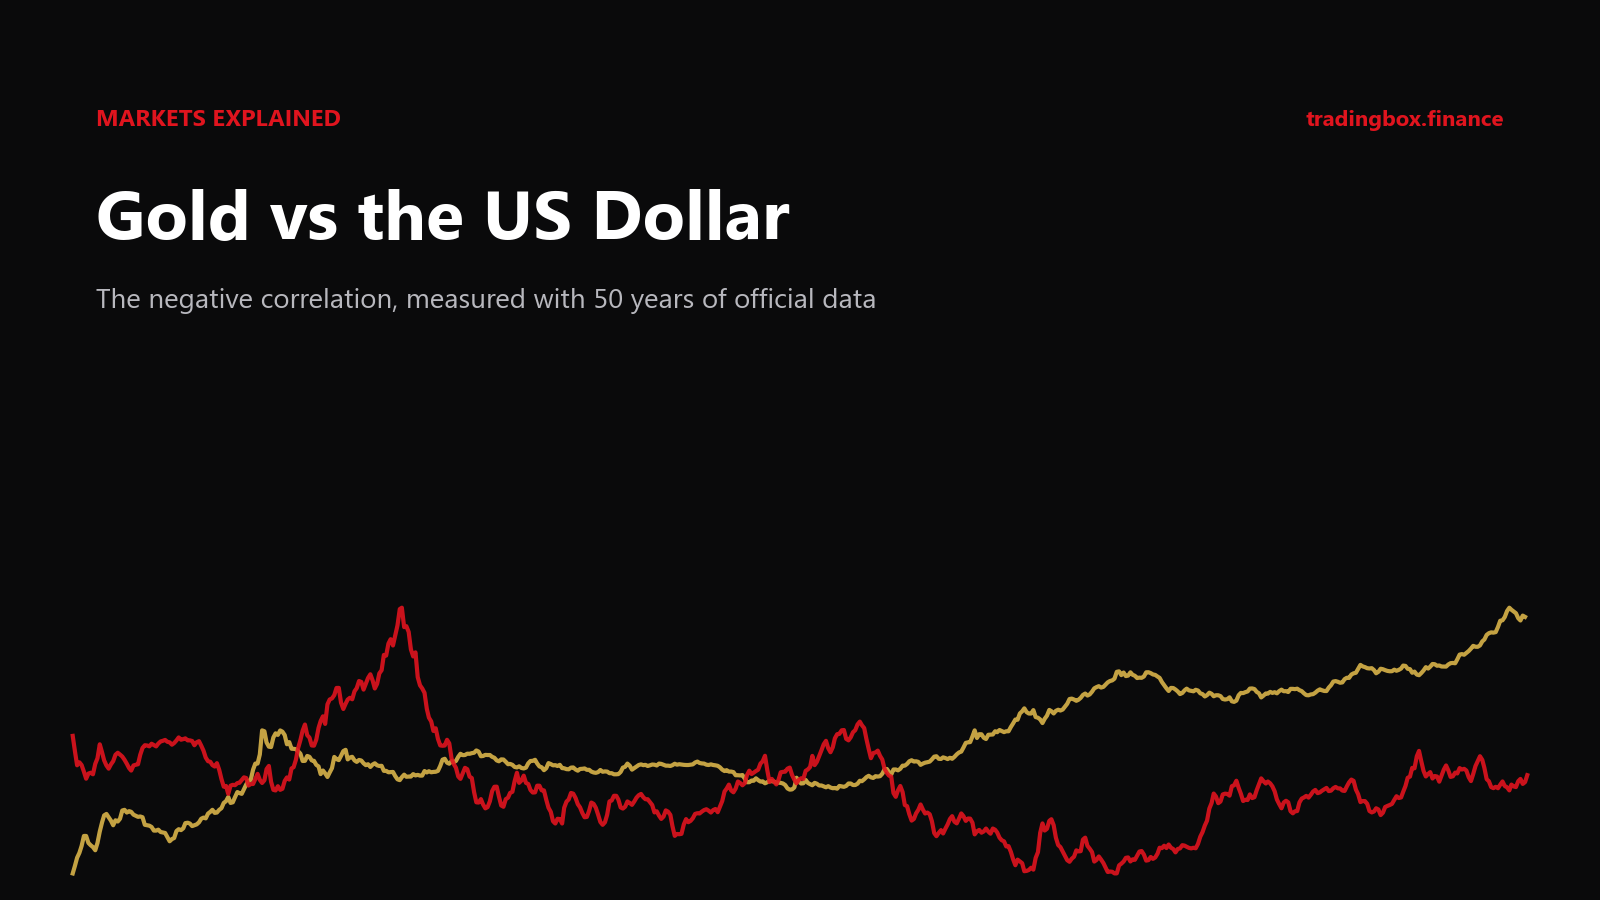
Ask ten traders about gold and most will tell you the same thing: "When the dollar goes up, gold goes down." It is one of the most repeated rules in trading. It is also only half true.
In this article we measure the relationship ourselves, using official data from 1973 to September 2026. You will see where the rule comes from, how strong it really is, why it worked for decades, why it suddenly looked broken after 2022, and how to use it in your own trading without falling into the usual traps.
Who this is for: if you are new, the first four sections give you everything you need. If you already know the basics, jump to the Going deeper section, where the data gets more interesting.
Key takeaways
- Gold and the US dollar have a negative correlation: in most months, when one rises, the other tends to fall.
- The link is real but moderate. From 1973 to 2026, the correlation of their monthly returns was -0.37. That is a clear tendency, not a law.
- The relationship has been negative in every decade since 1973, but its strength changes a lot: from close to zero in the late 1970s to about -0.7 in 2023–24.
- The deeper driver is US real interest rates. From 2003 to 2021, gold tracked real yields almost perfectly (correlation -0.91). From 2022 that link broke, mainly because central banks started buying gold on a record scale.
- Never treat a correlation as a trading signal on its own. Use it to measure hidden risk in your positions and to question your setups.
What is correlation? A plain definition
Correlation measures how two things move relative to each other. It is expressed as a single number, called the correlation coefficient and written r, that always sits between -1 and +1:
| Value of r | What it means | Example |
|---|---|---|
| +1 | They always move together, in the same direction | Two copies of the same chart |
| +0.7 to +0.9 | Strong positive: usually move together | EURUSD and GBPUSD in recent years |
| around 0 | No consistent relationship | Two unrelated markets |
| -0.3 to -0.5 | Moderate negative: tend to move in opposite directions | Gold and the US dollar |
| -0.9 to -1 | Strong negative: almost always opposite | EURUSD and USDCHF in 2012–14 |
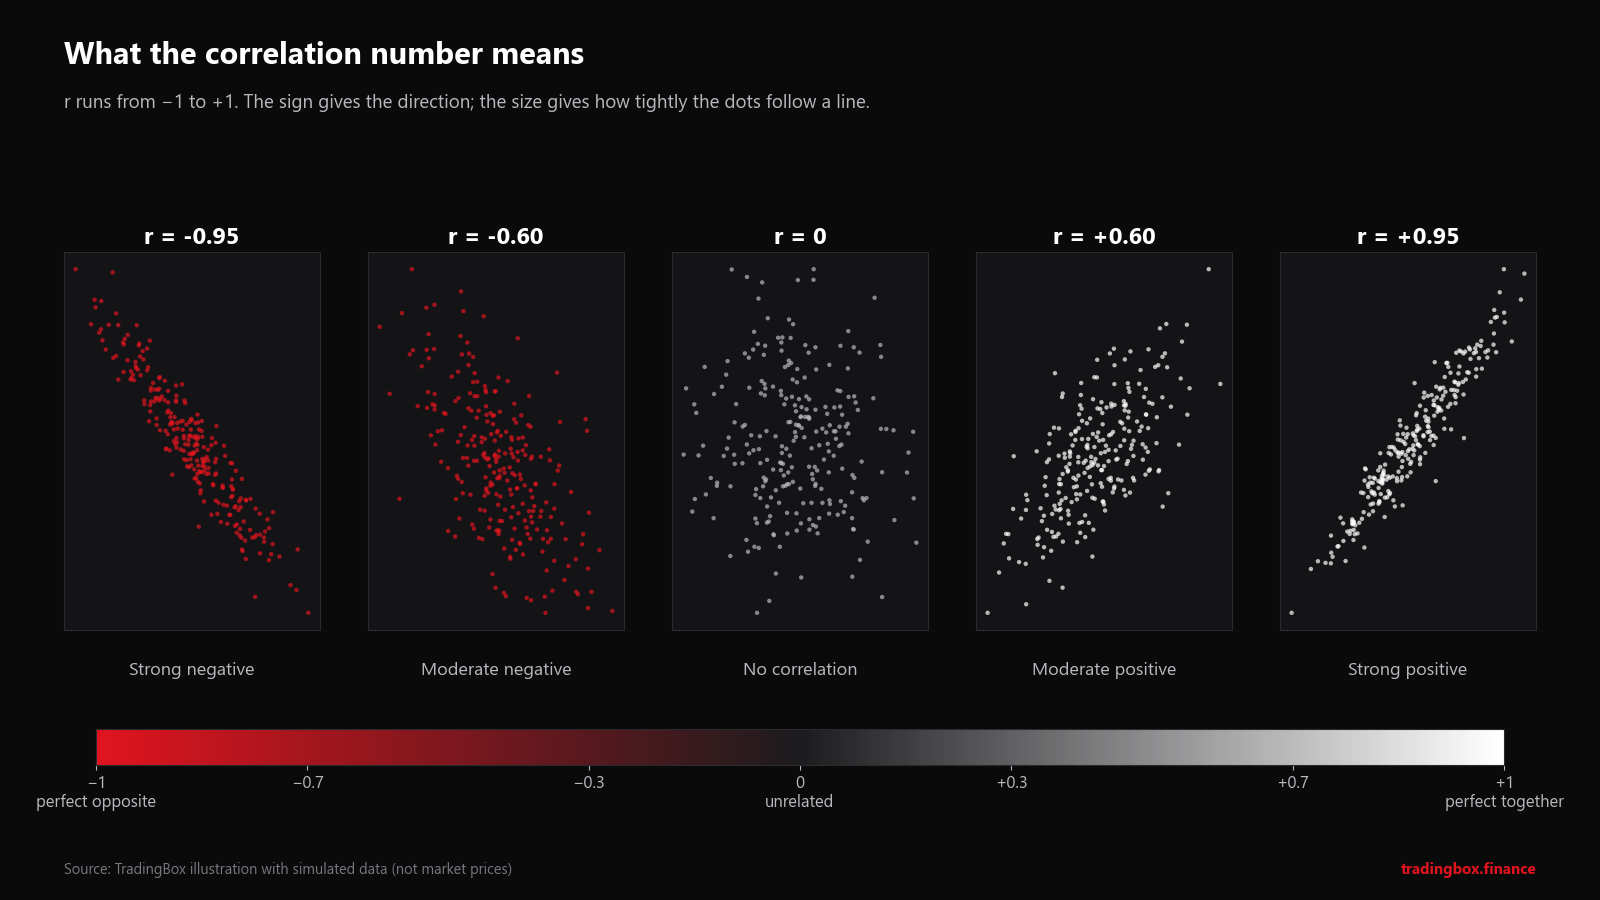
Each dot is one observation (for example, one month). The tighter the dots follow a line, the stronger the correlation. The direction of the line gives the sign.
Two things the number does not tell you:
- Size of the moves. A correlation of -0.9 does not mean gold falls 0.9% when the dollar rises 1%. It only says how consistently they move in opposite directions. The size of the move is a different measure called beta (the slope of the line).
- Cause. Correlation says nothing about why two things move together. Both might be reacting to a third force. As you will see, that is exactly what happens with gold and the dollar.
Why gold and the dollar usually move in opposite directions
There are four main reasons, and they work together.
1. Gold is priced in dollars
Gold trades worldwide in US dollars per troy ounce. When the dollar weakens, gold becomes cheaper for anyone paying in euros, yen, rupees or Lebanese pounds converted to another currency. Cheaper gold attracts more buyers, which pushes the dollar price up.
A simple example. Suppose gold costs $4,000 and EURUSD is 1.1000. A European buyer pays 4,000 ÷ 1.10 = €3,636.
Now the dollar weakens by 5% and EURUSD moves to 1.1550. If gold's value in euros stays exactly the same at €3,636, its price in dollars becomes 3,636 × 1.155 = $4,200.
Nothing about gold changed. Only the measuring stick changed. Economists call this the numéraire effect: part of what we see as "gold going up" is really "the dollar going down".
2. Interest rates hit both at once
Gold pays no interest and no dividend. Holding it has an opportunity cost: the interest you could have earned in a dollar deposit or a US Treasury bond.
When US interest rates rise (especially real rates, meaning after inflation):
- dollar assets pay more, so money flows into the dollar, and
- holding gold costs more in lost interest, so demand for gold falls.
One cause, two opposite effects. This is the single most important reason behind the negative correlation, and we come back to it in the the Going deeper section section.
3. Two competing stores of value
Gold and the dollar compete for the same job: being the safe place to keep wealth. When confidence in US policy, US debt or the dollar's purchasing power falls, some of that money moves into gold. When confidence is high, gold looks less necessary.
4. Inflation
Gold has a long reputation as a hedge against inflation. High US inflation erodes what a dollar can buy, which tends to weaken the dollar and support gold, as long as interest rates do not rise faster than inflation.
A short history in five pictures
1944–1971: when gold and the dollar were the same thing
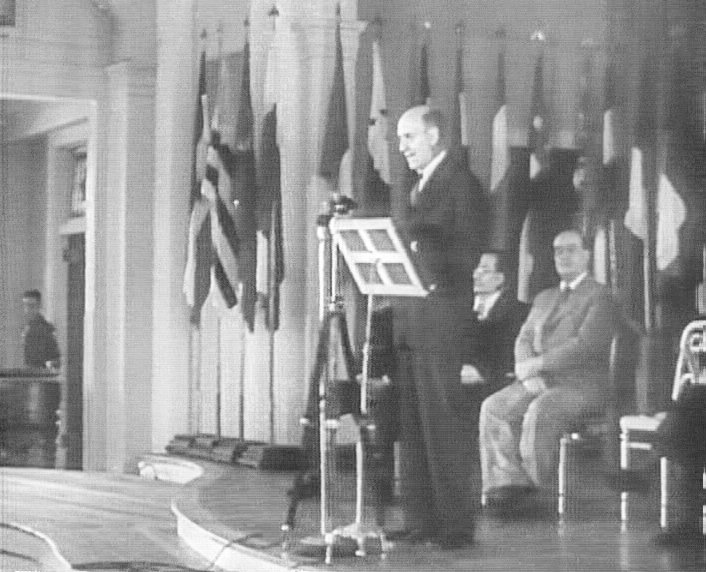
US Treasury Secretary Henry Morgenthau opens the Bretton Woods Conference, July 1944. Photo: US National Archives (NARA), public domain, via Wikimedia Commons.
In July 1944, delegates from 44 Allied countries met at Bretton Woods, New Hampshire, to design the post-war money system. The result: other currencies were pegged to the US dollar, and the dollar was convertible into gold at a fixed $35 per ounce for foreign governments.
Under that system there was no "gold vs dollar" correlation to trade. The price was fixed by agreement.
That price itself came from an earlier decision. In April 1933, President Roosevelt's Executive Order 6102 required Americans to hand in most of their gold coins, bullion and gold certificates to the Federal Reserve at the official price of $20.67. In January 1934 the Gold Reserve Act revalued gold to $35, a devaluation of the dollar of about 41% against gold overnight.
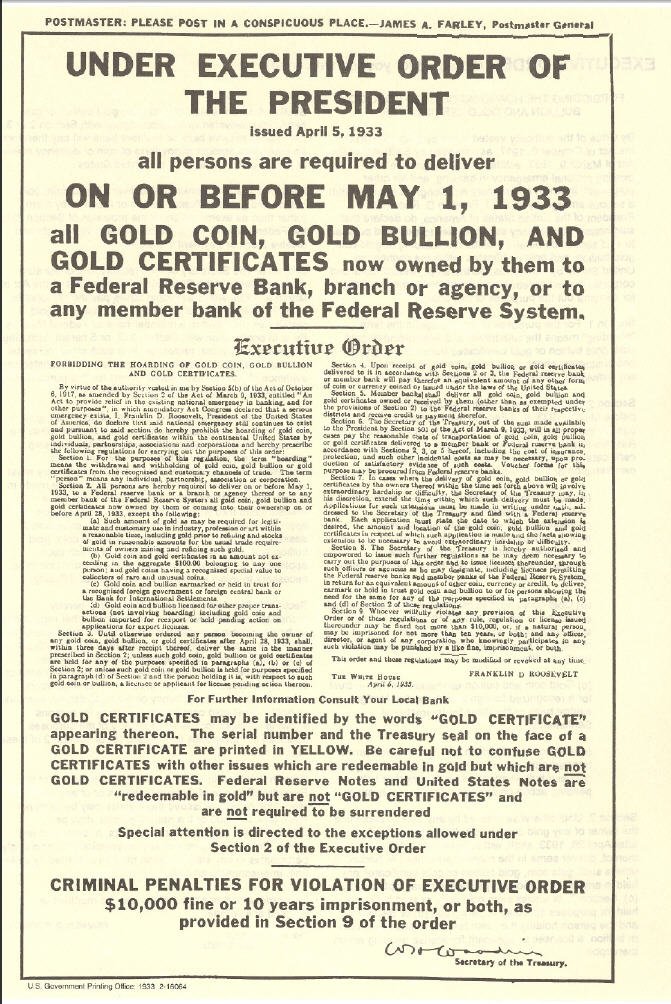
The 1933 notice of Executive Order 6102. Image: US Government Printing Office, public domain, via Wikimedia Commons.
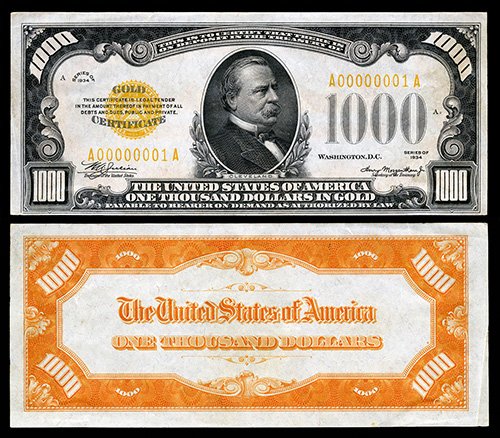
A Series 1934 $1,000 gold certificate. After 1933, gold certificates like this were reserved for the government and the Federal Reserve. Image: National Museum of American History, public domain, via Wikimedia Commons.
15 August 1971: the "Nixon shock"
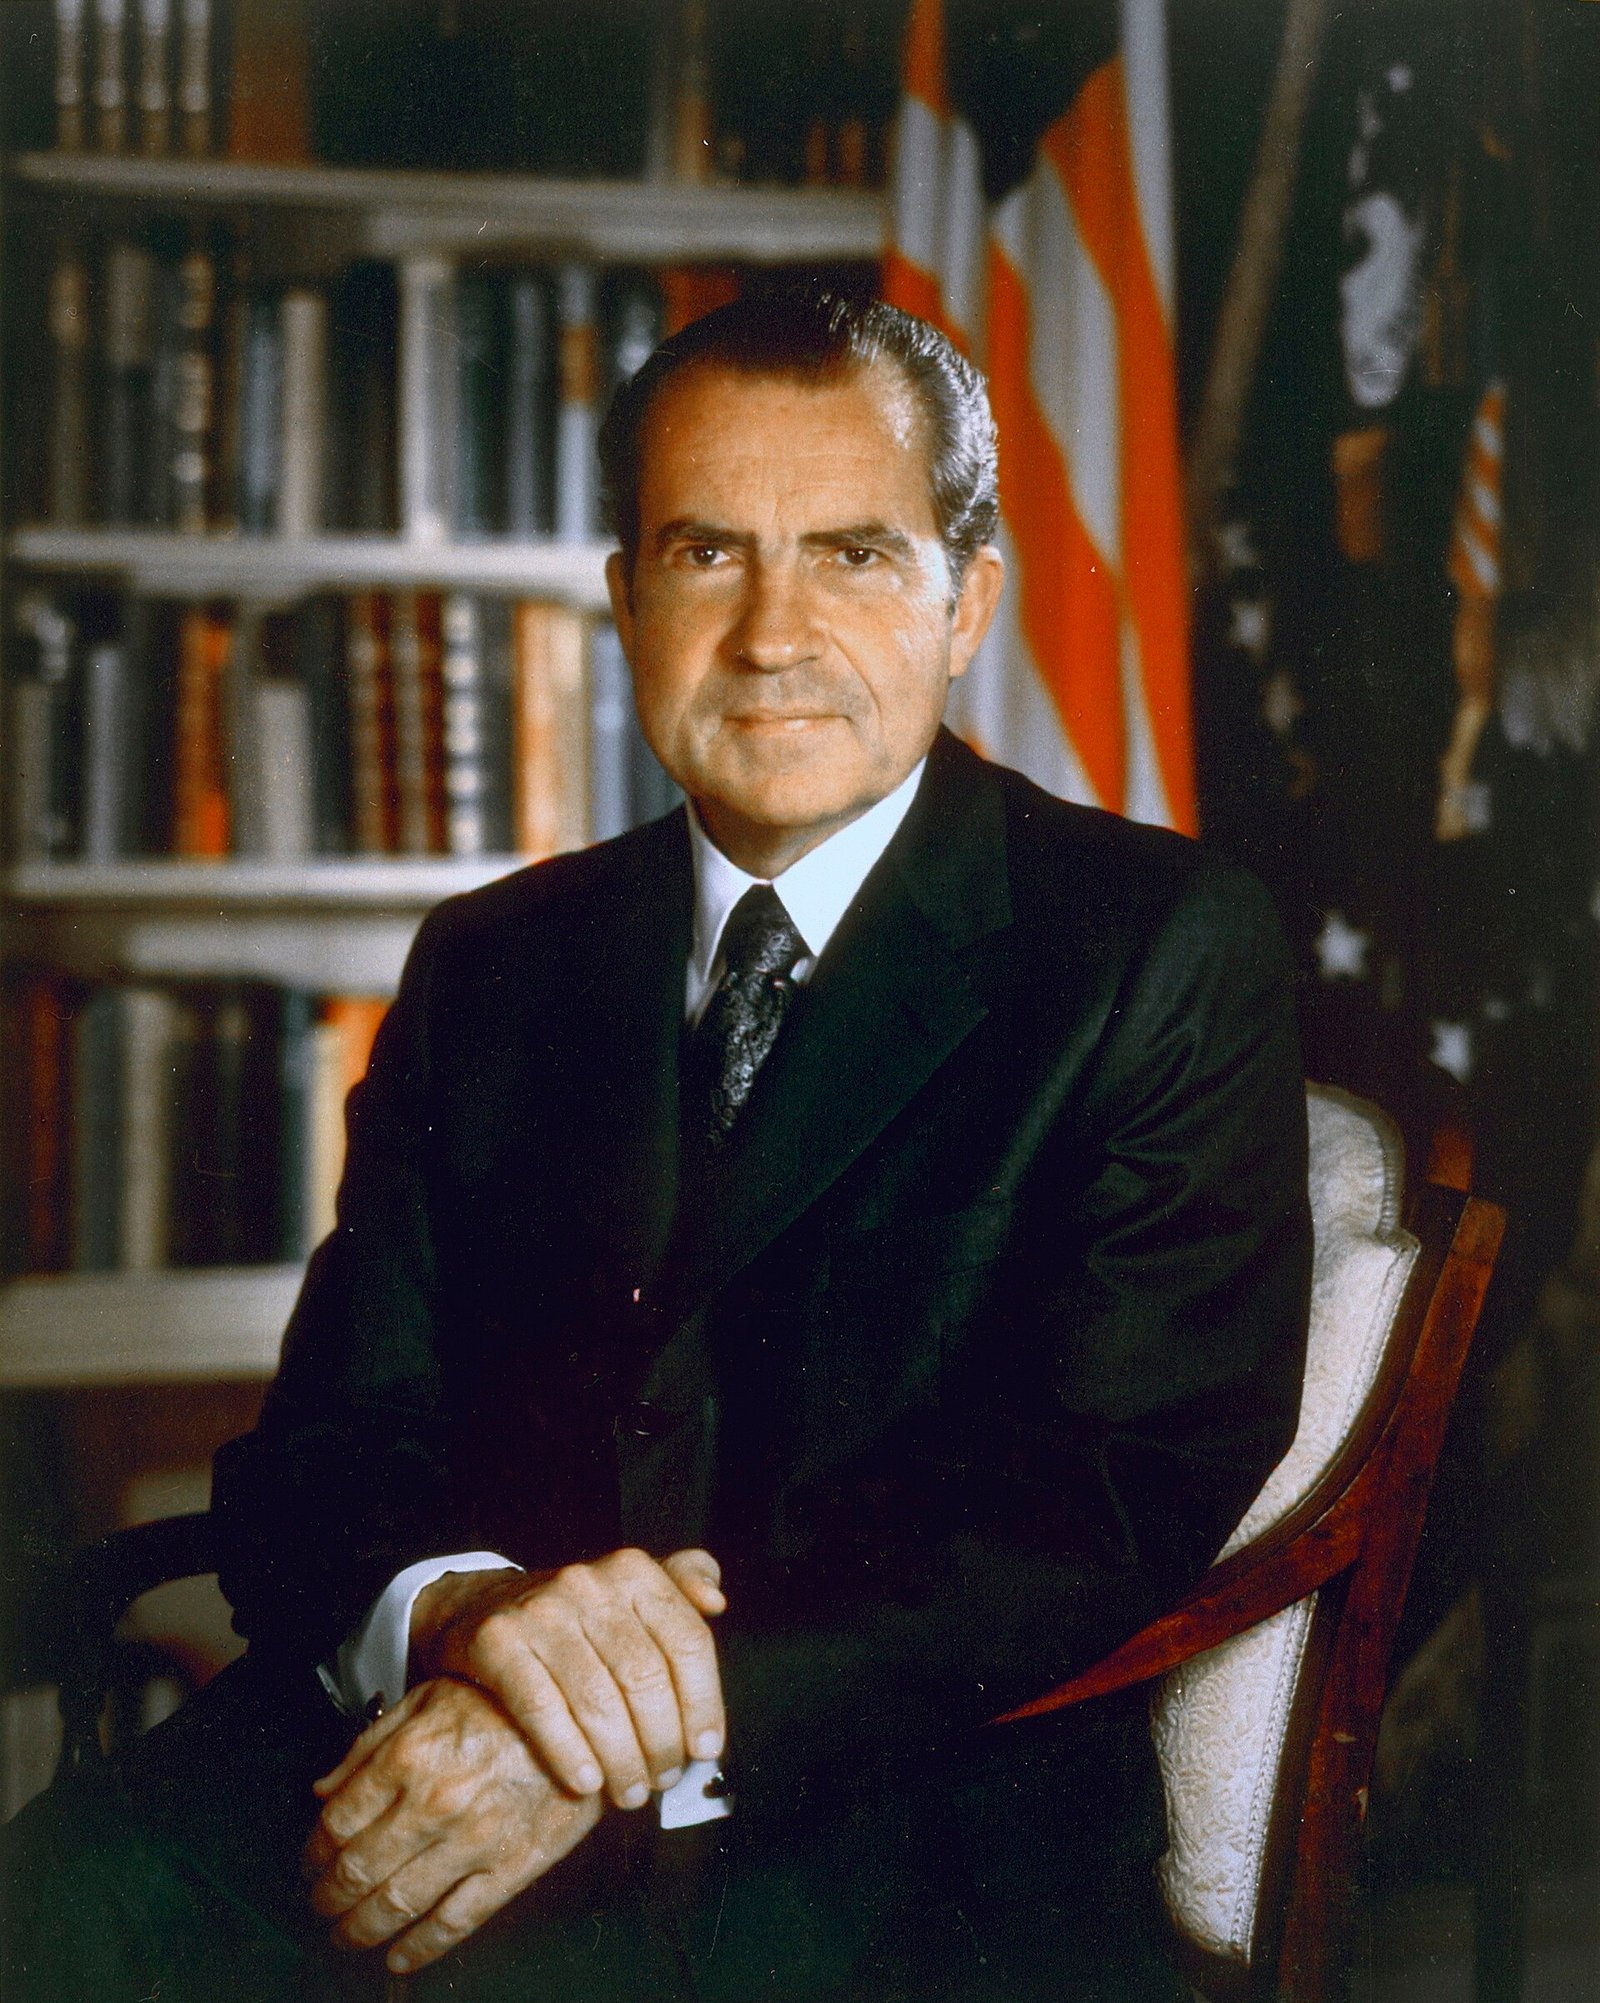
President Richard Nixon, official photograph, July 1971. Photo: Oliver F. Atkins, White House, public domain, via Wikimedia Commons.
By the late 1960s, the United States did not hold enough gold to honour $35 conversion for all the dollars held abroad. On 15 August 1971, President Nixon announced on television that the US would "suspend temporarily the convertibility of the dollar into gold". The suspension was never reversed. By 1973 the major currencies were floating, and gold became a freely traded market priced in dollars.
This is where the gold–dollar correlation begins. Every chart in the rest of this article starts in 1973.
1973 to today: the data
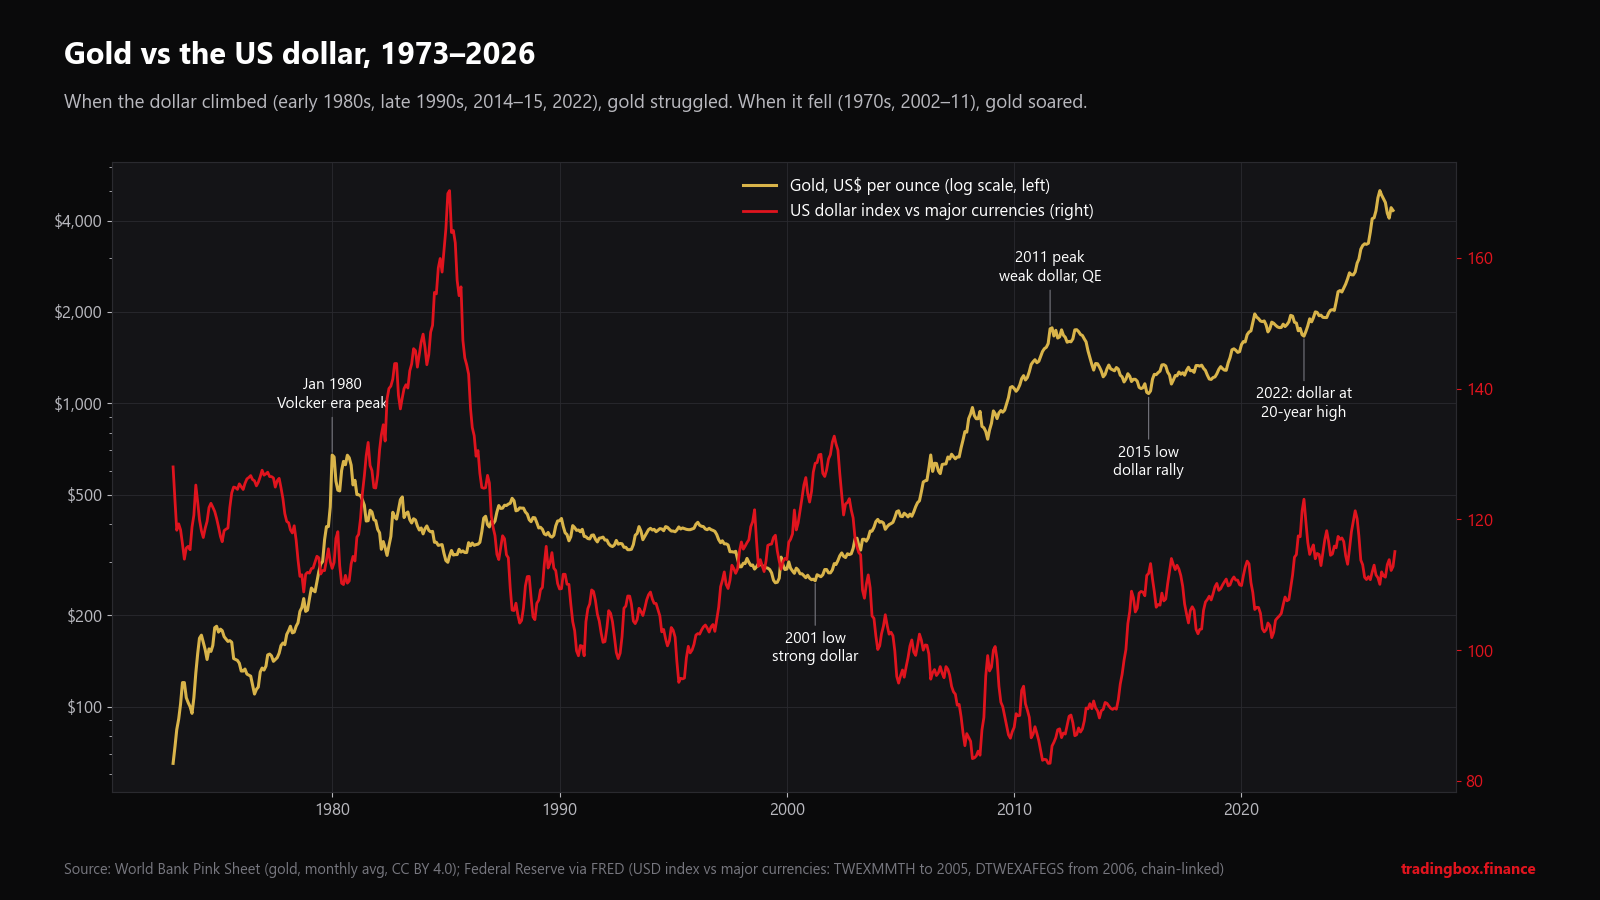
Read the chart in eras:
- 1970s: the dollar weakened and inflation exploded. Gold rose from about $65 in early 1973 to a monthly average of $675 in January 1980 (on 21 January 1980 it briefly touched $850).
- 1980–1985: Fed Chairman Paul Volcker raised interest rates to fight inflation. The dollar soared to its highest level of the period; gold lost more than half its value.
- Late 1990s: strong US economy, strong dollar, central banks selling gold. Gold bottomed near $260 in 1999–2001.
- 2002–2011: the dollar fell for most of a decade, then the 2008 crisis brought near-zero rates and quantitative easing (QE). Gold climbed to a monthly average of $1,772 in September 2011.
- 2013–2015: the Fed signalled the end of QE, the dollar rallied, and gold fell back to about $1,070 by December 2015.
- 2022 onward: this is where it gets strange. In September 2022 the dollar index reached its highest level since 2002, yet gold did not collapse. Then gold went on to set record after record: a monthly average of about $5,020 in February 2026, and $4,319 in September 2026.
The 2022–2026 period is the reason many traders now say "the gold–dollar correlation is dead". As you will see, that is not quite right either.
How strong is the correlation, really?
We took monthly prices from 1973 to September 2026 and measured the correlation of their monthly percentage changes (we explain why changes, not prices, in the next section).
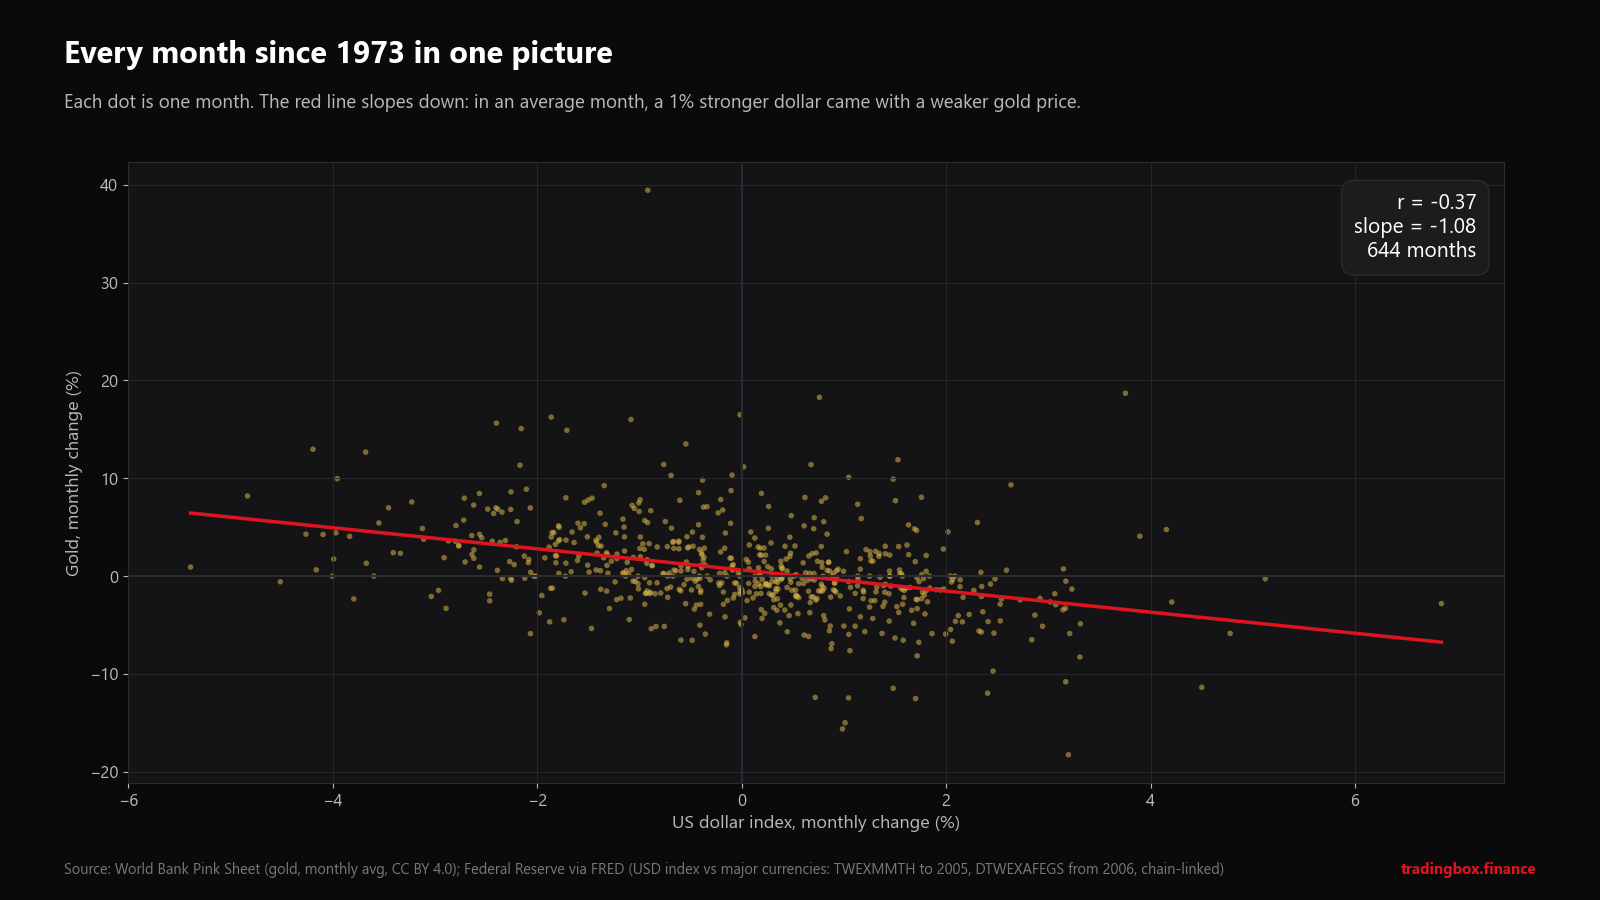
Each dot is one month: 644 of them. The result:
- r = -0.37 over the whole period.
- Slope = -1.08: in an average month, a 1% rise in the dollar index came with about a 1.1% fall in gold.
That sounds strong, but look at how scattered the dots are. Square the correlation and you get r² of about 0.14. In plain words: the dollar explains only about 14% of gold's monthly movements. The other 86% comes from everything else: interest rates, inflation expectations, fear, central bank buying, jewellery demand in India and China, ETF flows, and so on.
It is never fixed
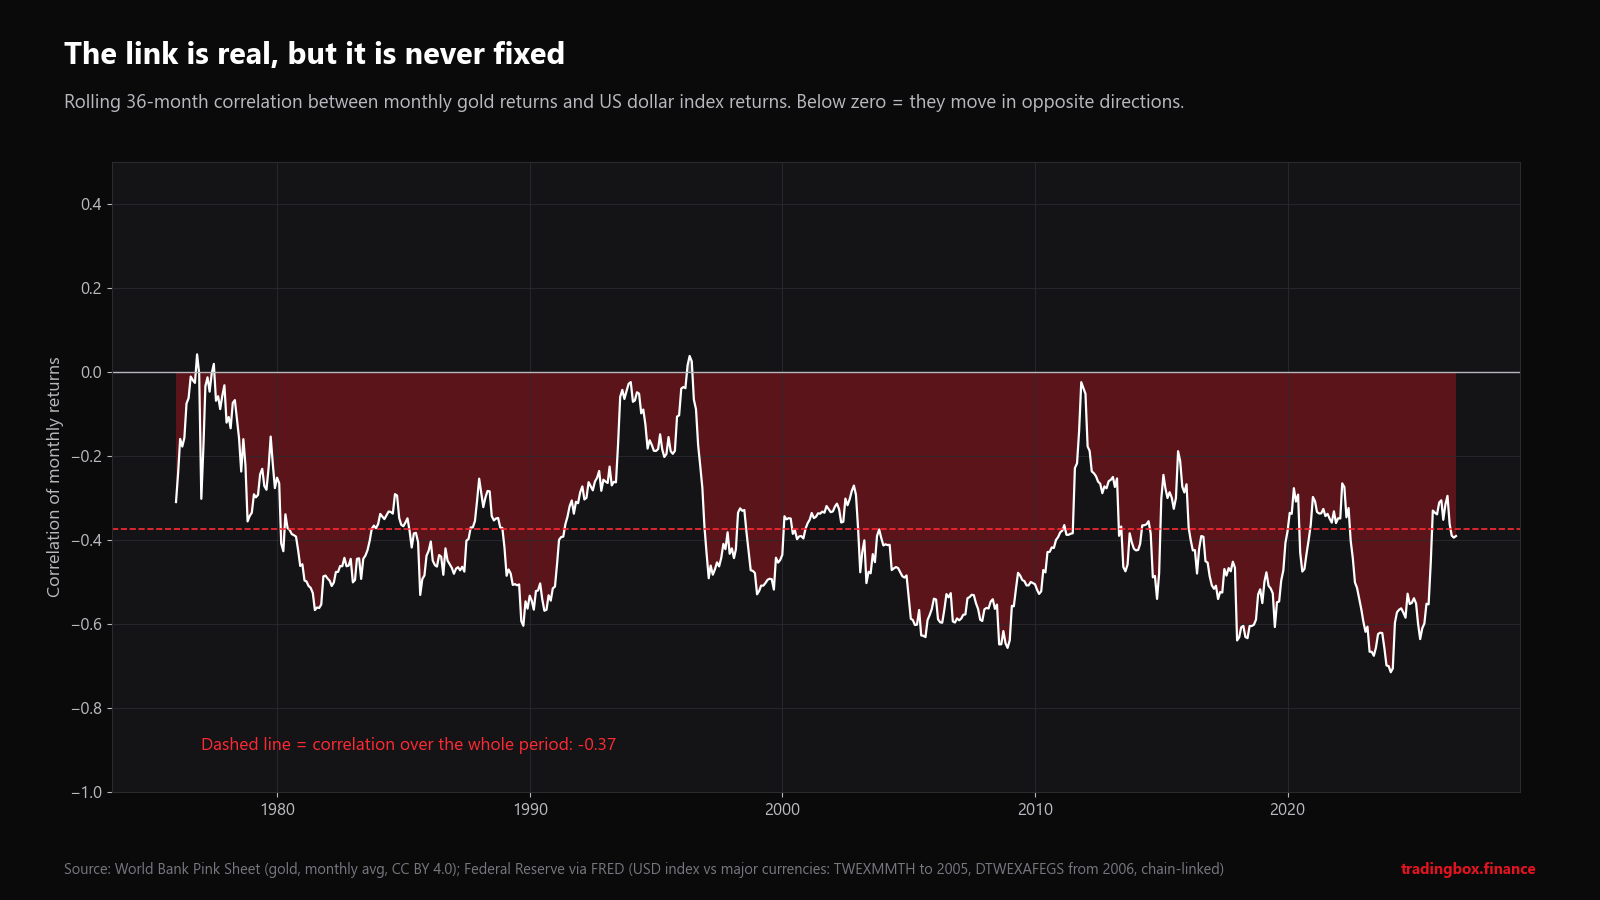
A rolling correlation recalculates the number every month using only the last 36 months. It shows how the relationship changes over time:
- It spent almost all of the last 50 years below zero: the negative link is persistent.
- It came close to zero in the late 1970s and the mid-1990s, when other forces dominated.
- It was strongest, at about -0.71 in early 2024, right in the middle of the period when people said the link was broken.
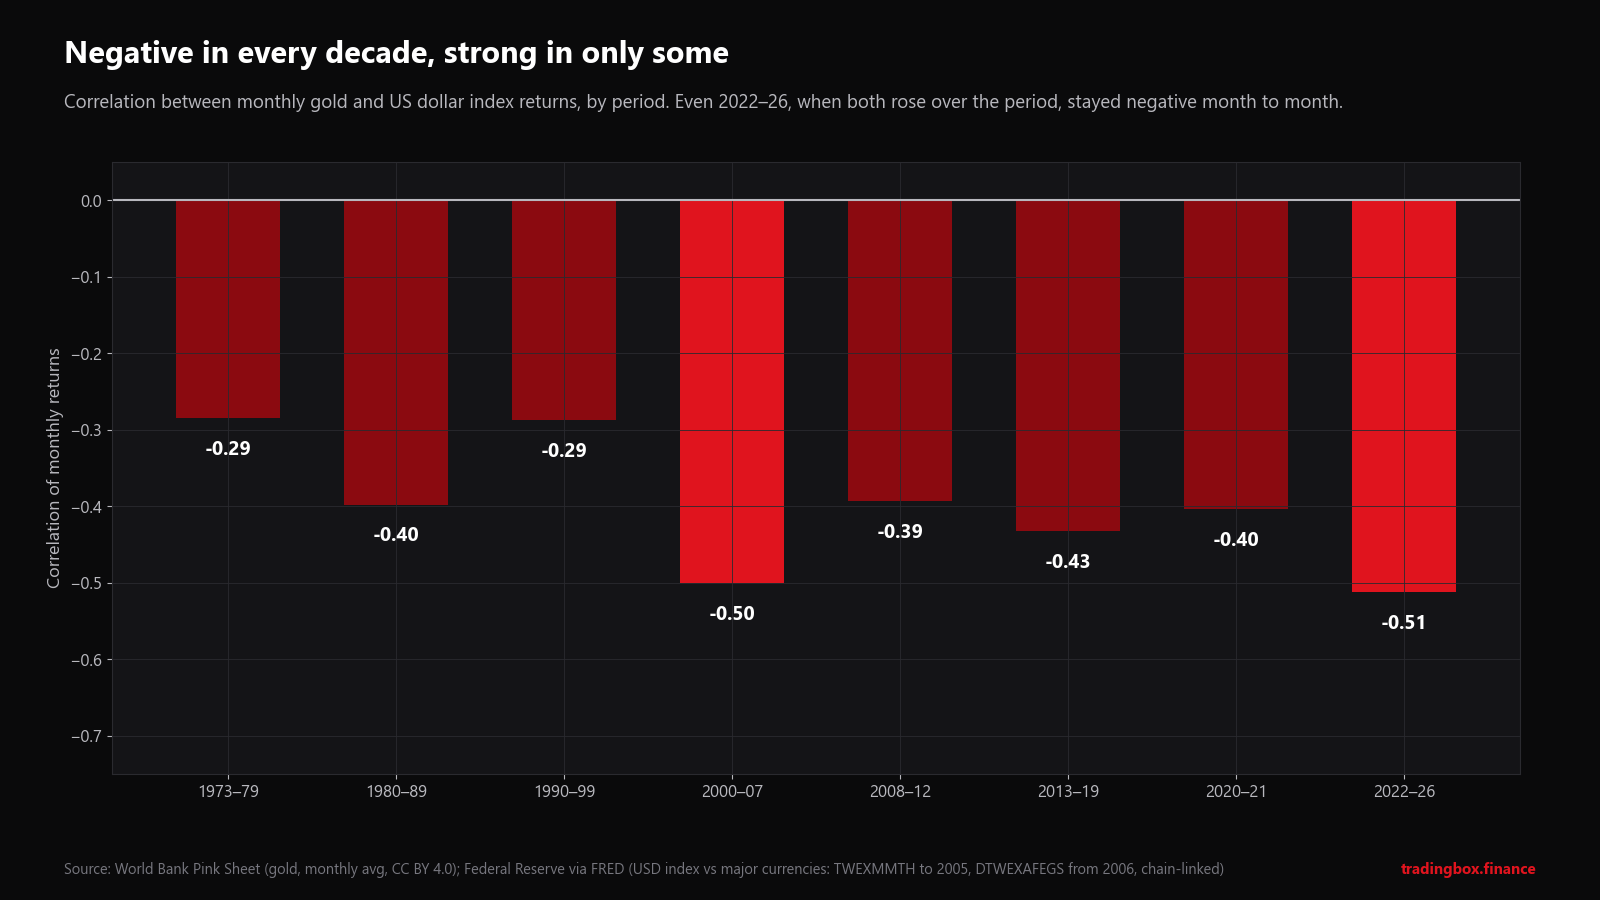
The surprise in this chart is 2022–26. Over those years gold more than doubled while the dollar index ended only about 7% higher, so the trends look unrelated. But month to month, the link was as strong as ever (-0.51): in months when the dollar rose, gold usually did worse than in months when it fell. What changed was the direction of the tide underneath, not the waves on top.
Going deeper: real interest rates, the hidden driver
If the dollar explains only 14% of gold's monthly moves, what explains more? For most of the past twenty years, the answer was US real interest rates.
A real interest rate is the interest rate after inflation. The cleanest market measure is the yield on 10-year TIPS (Treasury Inflation-Protected Securities), published daily by the Federal Reserve.
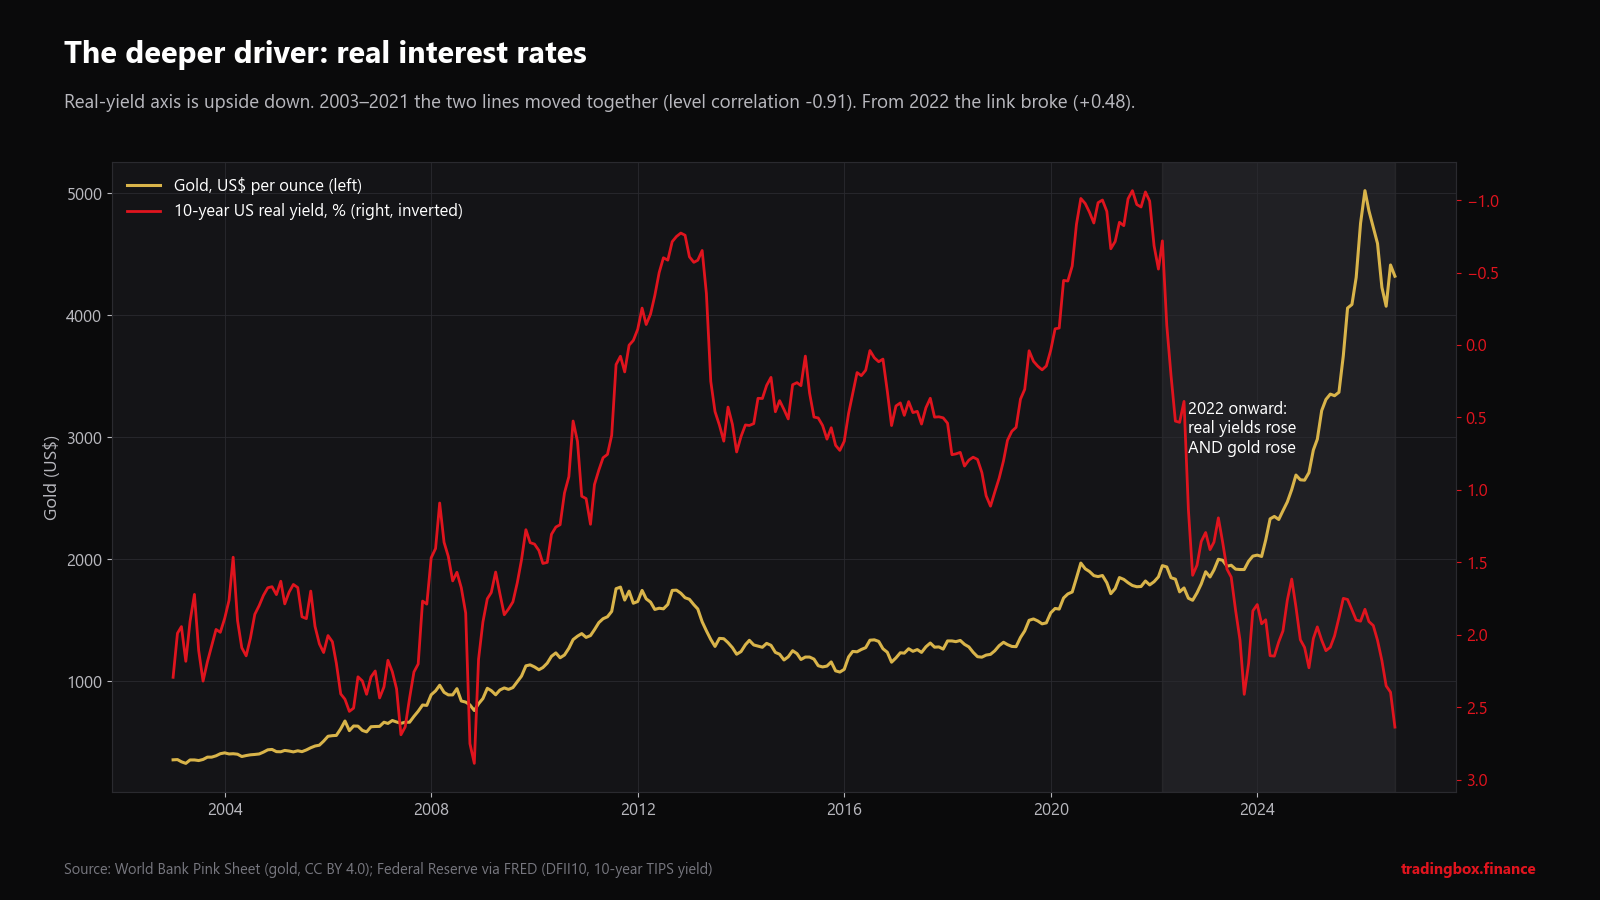
Note: the real-yield axis is upside down, so that "lines moving together" means "gold up when real yields fall".
From 2003 to 2021, the two lines are almost the same shape. The correlation between gold's price and the real yield was -0.91, much stronger than gold's link with the dollar. When real yields went negative (2012, 2020–21), gold made major highs. When real yields rose (2013, 2018), gold fell.
This also explains why gold and the dollar are negatively correlated: rising US real rates strengthen the dollar and weaken gold at the same time. The dollar and gold are not so much pushing each other as both being pushed by the same hand.
2022: the link breaks
Then, from 2022, real yields jumped from about -1% in 2021 to between roughly +1.5% and +2.9% in the years since. By the old model, gold should have fallen hundreds of dollars. Instead it rose, and the level correlation flipped to +0.48.
What changed? The evidence points to new buyers who do not care much about US real yields:
- Central banks. After Western governments froze a large part of Russia's foreign reserves in February 2022, many central banks looked for a reserve asset that cannot be frozen by another country. According to the World Gold Council, central banks bought more than 1,000 tonnes of gold a year in 2022, 2023 and 2024, and 863 tonnes in 2025, compared with an average of 473 tonnes a year in 2010–2021. Poland, China, Turkey, India, Kazakhstan and others were large buyers.
- Geopolitical risk (wars in Ukraine and the Middle East, trade conflicts) increased demand for an asset with no counterparty.
- Concerns about US debt and the long-run value of the dollar encouraged some investors to diversify away from it.
An important detail most articles miss: even after 2022, the month-to-month changes in gold and real yields kept a negative correlation (about -0.45, close to the -0.49 of 2003–21). Real yields still pushed gold around from month to month. They simply stopped deciding the trend. For a trader, that distinction matters: short-term reactions to US data (CPI, NFP, Fed decisions) still follow the old logic, while the long-term direction was set by forces outside the US bond market.
When the rule fails in the short term
There are also sharp, short episodes when gold and the dollar move in the same direction:
- Panic selling ("dash for cash"). In the worst days of October 2008 and March 2020, investors sold everything, including gold, to raise dollars. Both "safe havens" went in opposite directions to the textbook: the dollar spiked and gold fell. Gold recovered within weeks both times.
- Crisis in the rest of the world. When the trouble is in Europe, Japan or emerging markets, both the dollar and gold can rise together as safe havens.
- Central bank buying waves, as in 2022–2026.
How to measure the correlation yourself
You do not need special software. A spreadsheet is enough.
Step 1. Get the data. Export daily closing prices for both instruments. In MetaTrader 5: View > Symbols > Bars, choose the symbol and timeframe, then Request and Export. Use a dollar index or a major dollar pair (EURUSD inverted works as a rough proxy) and XAUUSD.
Step 2. Use returns, not prices. In a new column, calculate each day's change:
=LN(B3/B2) (log return) or =B3/B2-1 (simple return).
Why returns? Two series that both trend upward will show a high "correlation" of prices even if they have nothing to do with each other. Returns remove the trend and show whether the day-to-day moves are related. We show a striking example of this trap in our guide to forex correlations.
Step 3. Calculate the correlation. In Excel or Google Sheets:
=CORREL(C3:C254, D3:D254) for about one year of daily returns.
Step 4. Make it rolling. Write the formula for the first 60 rows, then drag it down so each row uses the 60 rows above it. Plot the result. You now have the same kind of chart as the rolling correlation above.
Step 5. Check whether it means anything. A quick rule of thumb: with n observations, a correlation is unlikely to be pure chance only when its size is above about 2 divided by the square root of n.
| Observations (n) | Correlation needed (approx.) |
|---|---|
| 20 (one month of days) | 0.45 |
| 36 (three years of months) | 0.33 |
| 60 | 0.26 |
| 250 (one year of days) | 0.13 |
So a "-0.3 correlation over the last 20 days" is mostly noise. The same number over 250 days is meaningful.
Choosing the window
| Window | Good for | Weakness |
|---|---|---|
| 20 days | Seeing very recent changes | Very noisy, jumps around |
| 60–120 days | Swing trading, current risk | Can still swing quickly |
| 52 weeks / 36 months | The underlying relationship | Slow to show a regime change |
Many professionals look at two windows together: a short one and a long one. When the short window moves far from the long one, something in the market has changed, and that is information in itself.
How to use it in your trading
1. Find your hidden double positions
This is the most valuable use, and the most ignored. Suppose you are long XAUUSD, long EURUSD and short USDJPY. It feels like three different trades. In reality, all three win if the dollar falls and all three lose if it rises. You have one large bet against the dollar, with three times the risk you think you have.
Before opening a new position, ask: "What does this trade have in common with what I already hold?" Size the combined exposure, not each trade alone. Our free lot size calculator helps you size each leg so the total risk stays within your plan, and our position size guide explains the method step by step.
2. Do not expect a correlation to be a hedge
A trader long gold who buys the dollar index "as a hedge" is only partly covered. With a correlation of about -0.4, the hedge removes only around 16% of the risk (the square of the correlation). Hedges based on moderate correlations are mostly an illusion.
3. Use the dollar to question a gold setup
- Gold breaking out while the dollar is falling: the move has support from its usual driver.
- Gold rising while the dollar is also rising: something else is pushing gold (fear, central bank buying, a crisis outside the US). These moves can be powerful, but they can also reverse quickly when that other driver fades. Be more careful with position size and stops.
4. Watch the events that move both
US inflation (CPI), jobs (Non-Farm Payrolls) and Federal Reserve decisions move the dollar, US yields and gold at the same moment. A position that looks diversified can lose on all fronts within seconds of a release. Check the times on our free economic calendar before you trade around them, and read how to use an economic calendar for what happens around a release.
5. Do not trade the correlation itself
Correlations describe the past. They do not predict the next candle, and there is no reliable "the dollar moves first, gold follows" pattern you can trade on short timeframes. Use correlation to understand and control risk, not as an entry signal.
Frequently asked questions
Is the gold–dollar correlation always negative? Over long periods, yes: it has been negative in every decade since 1973. Over short windows it can briefly turn positive, for example during panics or when central banks are buying heavily.
Why did gold rise in 2022–2026 while the dollar was strong? Mainly because of record central bank buying after 2022, geopolitical risk and doubts about the long-term value of the dollar. Month to month, gold still reacted negatively to a stronger dollar and higher real yields; it was the long-term trend that broke away.
Which dollar index should I use? The popular DXY index is heavily weighted to the euro (about 58%). The Federal Reserve publishes broader trade-weighted indexes. For trading, EURUSD inverted is a simple, liquid proxy, but remember it reflects the euro too.
Does gold also have a negative correlation with other currencies? Gold priced in dollars tends to be positively correlated with currencies that rise when the dollar falls (EURUSD, AUDUSD) and negatively with pairs where the dollar is first (USDCHF, USDJPY). We cover these and many more in our guide to forex correlations.
Sources and method
- Gold prices: World Bank Commodity Price Data (The Pink Sheet), monthly average prices in US dollars, 1960–September 2026. Licensed CC BY 4.0.
- US dollar index: Federal Reserve Board, via FRED (Federal Reserve Bank of St. Louis): Nominal Major Currencies Dollar Index (TWEXMMTH) for 1973–2005 and Nominal Advanced Foreign Economies Dollar Index (DTWEXAFEGS) from 2006, linked into one series at January 2006. Both measure the dollar against the main advanced-economy currencies.
- Real yields: 10-year Treasury Inflation-Indexed Security, constant maturity (DFII10), Federal Reserve via FRED. Monthly averages.
- Correlations: Pearson correlation of monthly log returns (dollar index, gold) and of monthly changes in real yields. Rolling windows as stated on each chart. All calculations by TradingBox.
- Central bank gold purchases: World Gold Council, Gold Demand Trends, Full Year 2025.
- Historical photos: Wikimedia Commons, all public domain (US government works and the National Museum of American History).
- This product uses the FRED® API but is not endorsed or certified by the Federal Reserve Bank of St. Louis.
This article is for education only. It is not investment advice, and past relationships between markets do not guarantee future ones. Trading leveraged products such as CFDs carries a high risk of losing money.
Trading involves risk. See the risk disclaimer.