
Forex Correlations: The Pairs That Matter and Why
In our article on gold and the US dollar we measured one famous relationship over 50 years. Gold is not alone. Almost every market you trade is linked to others, and many traders hold the same risk three or four times without knowing it.
This guide covers the correlations every forex and gold trader should know. For each one you get the reason it exists, how strong it has really been (we measured every number from official central bank and World Bank data), when it broke, and what to watch. The second half shows you how to find and test correlations yourself, and the mistakes that make most published "correlation tables" useless.
Quick reminder: correlation (r) runs from -1 (always opposite) to +1 (always together). Around 0 means no consistent relationship. If that is new to you, read the first part of our gold article before this one.
Key takeaways
- Most currency correlations come from one shared ingredient: if two pairs both contain the US dollar, they share a large part of their movement.
- The strongest links (EURUSD–USDCHF, AUDUSD–NZDUSD, EURUSD–GBPUSD) are very reliable until a central bank or a crisis changes the rules, as the Swiss franc showed in 2015.
- Commodity links (CAD–oil, AUD–copper) are real but come and go. The CAD–oil link, the most quoted in trading books, has been close to zero since 2024.
- Always measure correlation on returns, over more than one window, and check whether it survives different periods. A correlation that only works in one period is not a correlation, it is a coincidence.
Ten years of correlations in one picture
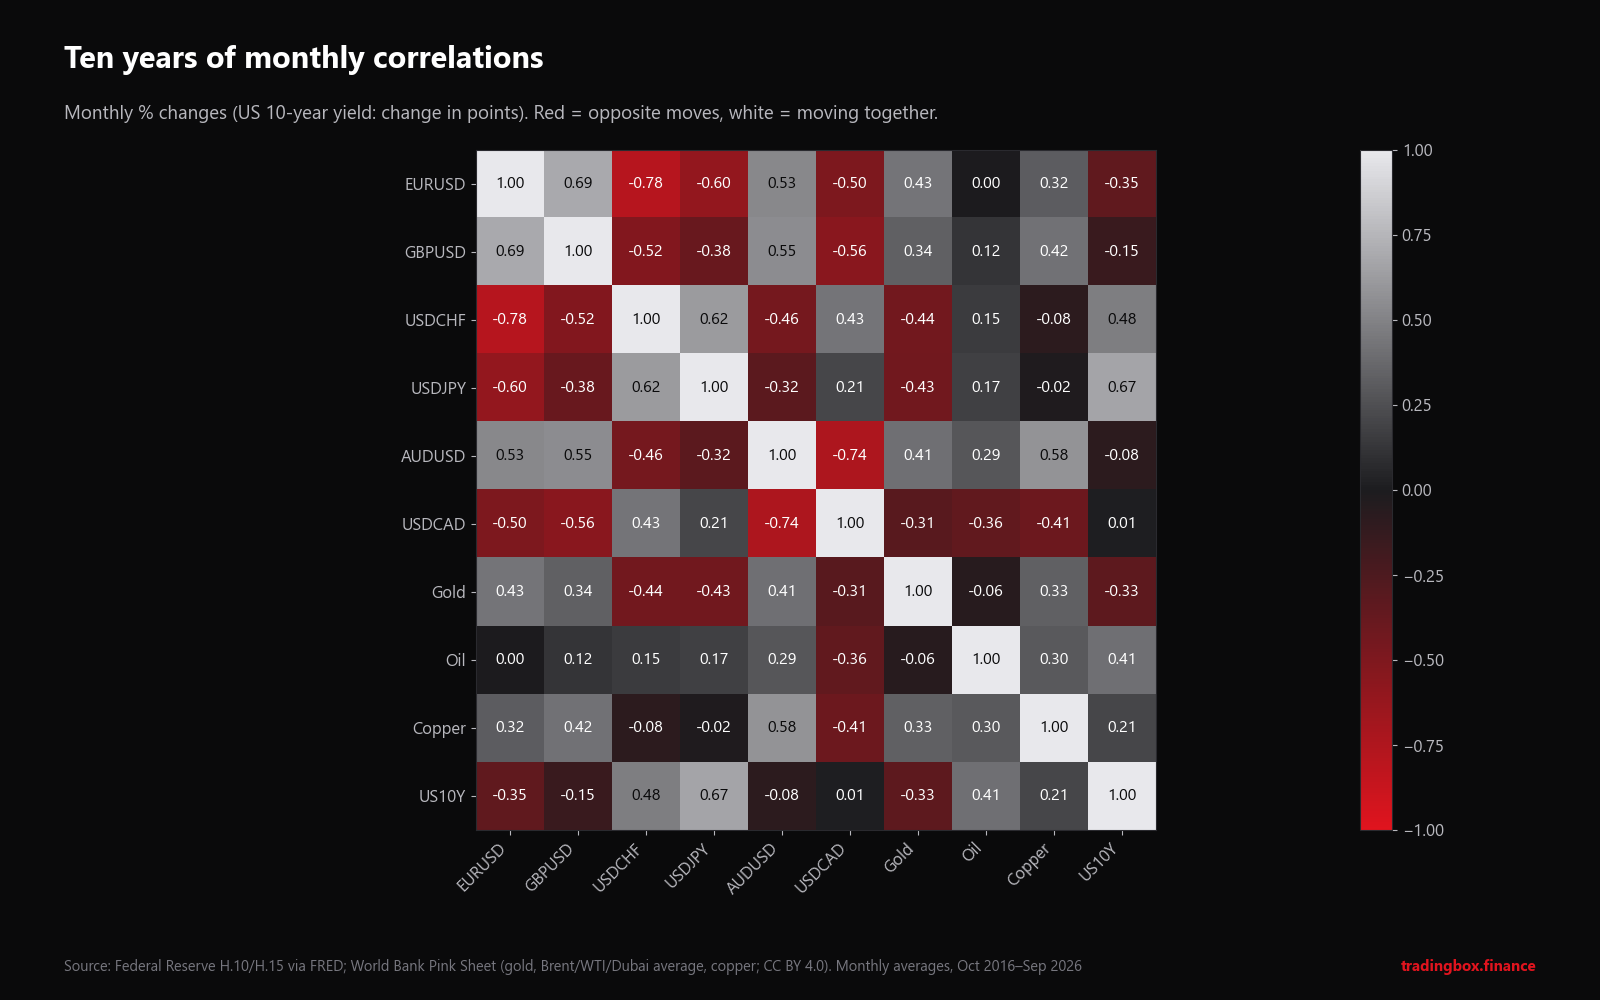
Monthly percentage changes, October 2016 to September 2026 (for the US 10-year yield, the change in percentage points). Red = they tend to move in opposite directions. White = they tend to move together.
How to read the quote convention (this confuses many traders). EURUSD and USDCHF show -0.78. That does not mean the euro and the franc move in opposite directions. It means the opposite: in EURUSD the dollar is the second currency, in USDCHF it is the first. When the dollar weakens, EURUSD goes up and USDCHF goes down. A strong negative correlation between the two pairs actually means the euro and the franc move together against the dollar.
Rule: before comparing two pairs, check where the dollar sits. If it is on the same side in both (EURUSD and GBPUSD), a positive number means the two currencies move together. If it is on opposite sides (EURUSD and USDCHF), a negative number means they move together.
Some numbers worth noticing in the map:
| Pair | r | What it tells you |
|---|---|---|
| EURUSD – USDCHF | -0.78 | Euro and franc move together against the dollar |
| AUDUSD – USDCAD | -0.74 | The two big commodity currencies usually move together |
| EURUSD – GBPUSD | +0.69 | Euro and pound share a lot of their moves |
| USDJPY – US 10Y yield | +0.67 | Higher US yields, weaker yen |
| AUDUSD – copper | +0.58 | Australia's link to industrial metals |
| Gold – USDCHF / USDJPY | -0.44 / -0.43 | Gold behaves partly like a "safe-haven currency" |
| Oil – US 10Y yield | +0.41 | Oil and bond yields both react to inflation expectations |
| EURUSD – oil | 0.00 | No consistent link at all |
The major correlations, one by one
1. EURUSD and USDCHF: near mirror images
Why it exists. Switzerland trades heavily with the euro area, and both currencies are driven by European conditions. Against the dollar, the euro and the franc tend to rise and fall together.
How strong. Over 2000–2026, the weekly correlation of EURUSD and USDCHF returns was -0.75. In 2012 it reached -0.99: the two pairs were almost exact mirrors.
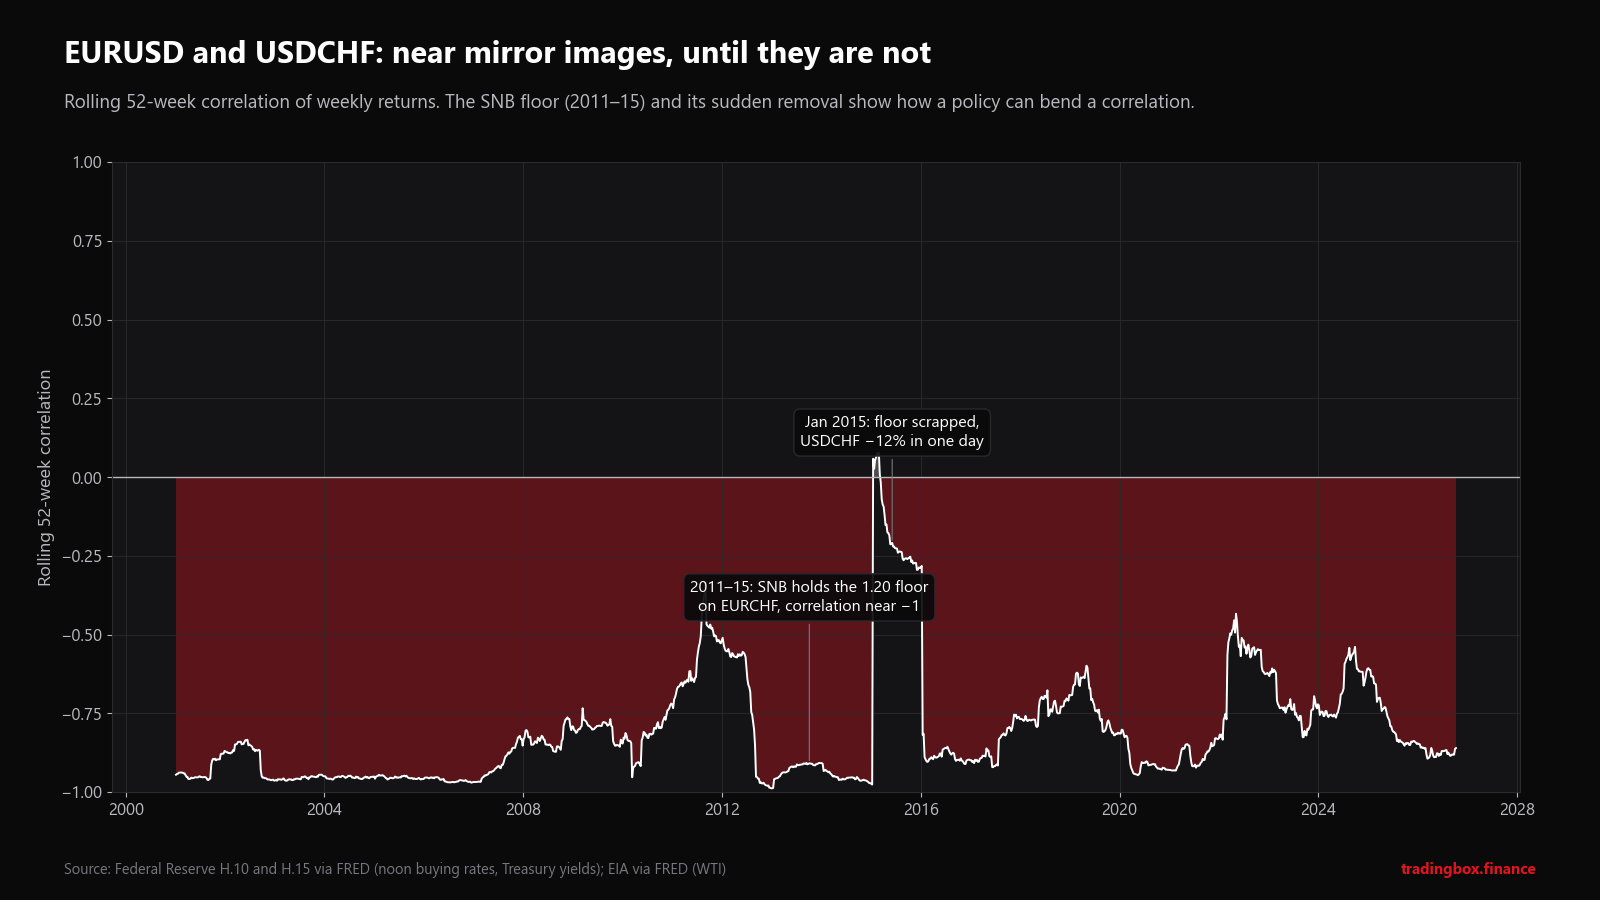
When it broke. That near-perfect -0.99 was not natural. From September 2011 the Swiss National Bank (SNB) enforced a minimum of 1.20 francs per euro, buying unlimited euros to stop the franc rising. EURCHF was pinned, so EURUSD and USDCHF had to mirror each other.
On 15 January 2015, the SNB abandoned the floor without warning. In the Federal Reserve's noon rates, USDCHF fell from 1.0172 to 0.8930 in a single day (-12%) and to 0.8488 the next day. The rolling correlation jumped from about -0.97 to above zero. Several brokers and many traders suffered large losses because prices gapped past their stop losses.
What to look for. A correlation held in place by a policy (a peg, a floor, a cap) can end in one announcement. When a central bank is defending a level, treat the "correlation" as a political decision that can be reversed, not as a market fact.
2. EURUSD and GBPUSD: neighbours, not twins
Why it exists. Both are large European economies with close trade links, and both are quoted against the dollar, so any dollar move shows up in both.
How strong. Weekly correlation +0.65 over 2000–2026, ranging from +0.42 (2009) to +0.87 (2024). In recent years it has been unusually high (+0.80 to +0.87).
When it weakens. When news is specific to one side: the 2008–09 UK banking crisis, the June 2016 Brexit referendum, or a sudden change in Bank of England vs ECB rate expectations. On those days, EURGBP (the cross) moves sharply and the correlation drops.
What to look for. A trader long EURUSD and long GBPUSD has mostly doubled one bet against the dollar. If you want exposure to the euro versus the pound, trade EURGBP directly.
3. AUDUSD and NZDUSD: the closest pair in forex
Why it exists. Australia and New Zealand are neighbours, trade heavily with each other and with China, and both export commodities.
How strong. Weekly correlation +0.84 over 2000–2026, and +0.87 over the last five years: one of the most stable relationships in the currency market.
What to look for. The difference between them (the AUDNZD cross) moves on relative interest rates (RBA vs RBNZ) and on the relative prices of what each exports: metals and energy for Australia, dairy and agricultural goods for New Zealand.
4. USDJPY and US interest rates
Why it exists. For most of the past 25 years, Japan kept interest rates near zero. The gap between US and Japanese rates was therefore driven mainly by US rates. When US yields rose, holding dollars instead of yen paid more, and USDJPY tended to rise. This is the logic of the carry trade: borrow in a low-rate currency, invest in a higher-rate one.
How strong. Weekly correlation between USDJPY returns and changes in the US 2-year yield: +0.38 over 2000–2026, with long periods around +0.6 to +0.8.
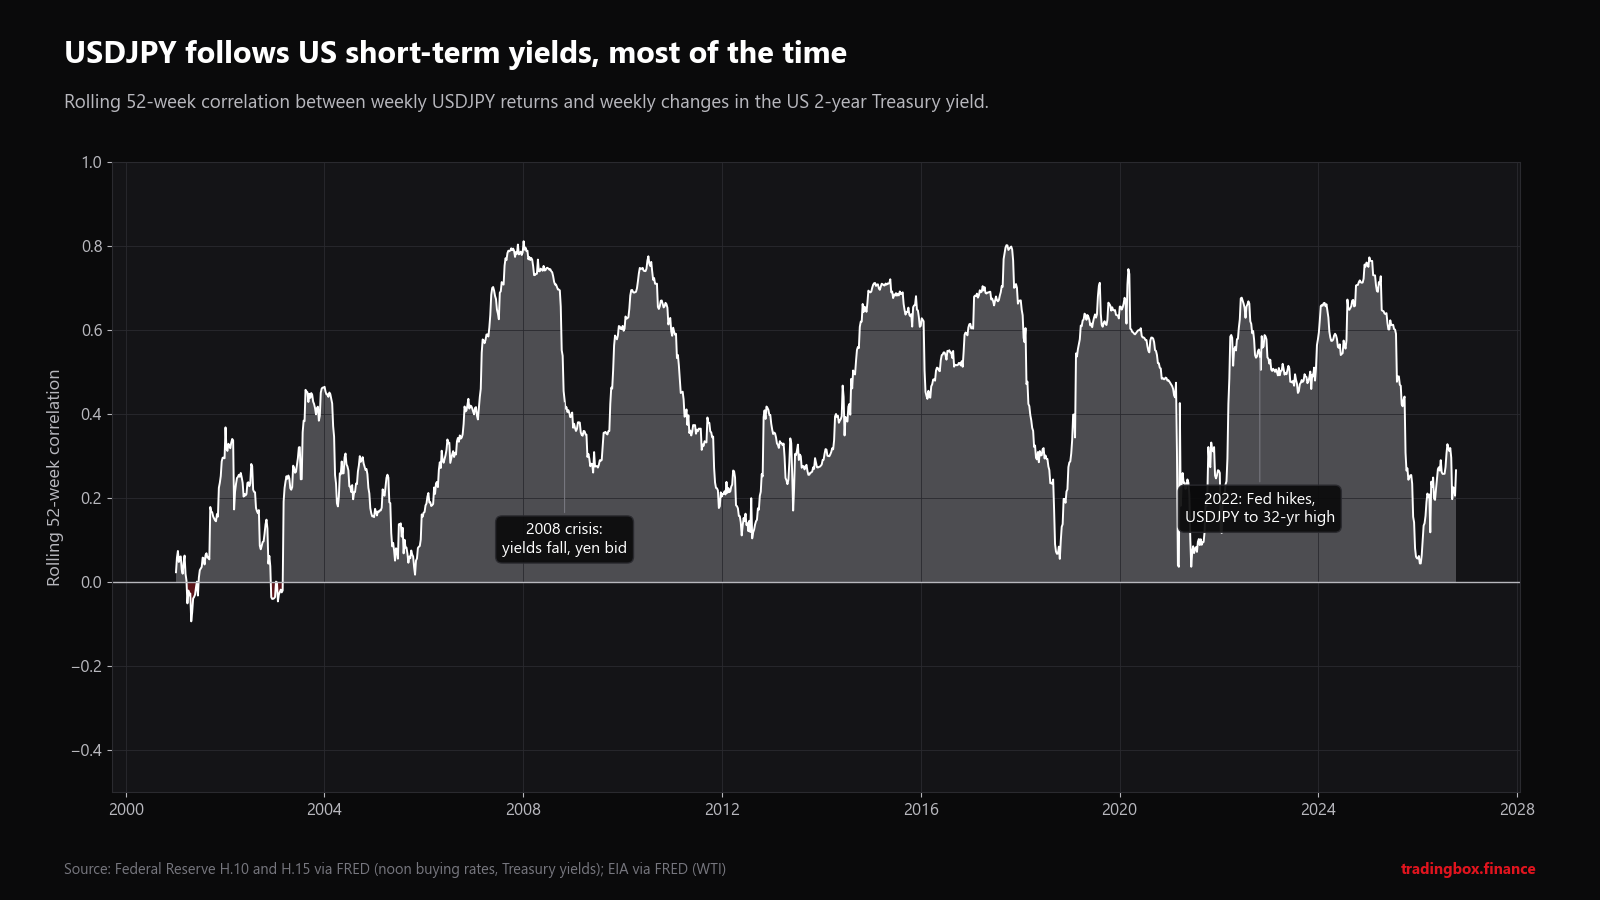
When it weakened. The link dropped sharply in 2025 (+0.06 for the 2-year yield, +0.02 for the 10-year). The likely reason is that the yen started moving on Japanese factors as well: the Bank of Japan began raising rates in 2024, ending years of negative rates, and Japan's Ministry of Finance intervened to support the yen in 2022 and 2024. When both sides of a rate gap move, the US side alone explains less.
What to look for. Watch the US 2-year yield (most sensitive to Fed expectations) alongside USDJPY, and treat Bank of Japan meetings and any official comments about "excessive moves" in the yen as events that can override the US rate link.
5. USDCAD and oil: the textbook pair that faded
Why it exists. Canada is one of the world's largest oil exporters, and energy is a large share of its exports. Higher oil prices bring more US dollars into Canada and tend to strengthen the Canadian dollar, so USDCAD falls when oil rises (negative correlation).
How strong. Weekly correlation -0.34 over 2000–2026. It was very strong after the 2008 crisis (-0.68 in 2010) and during the 2014–16 oil collapse.
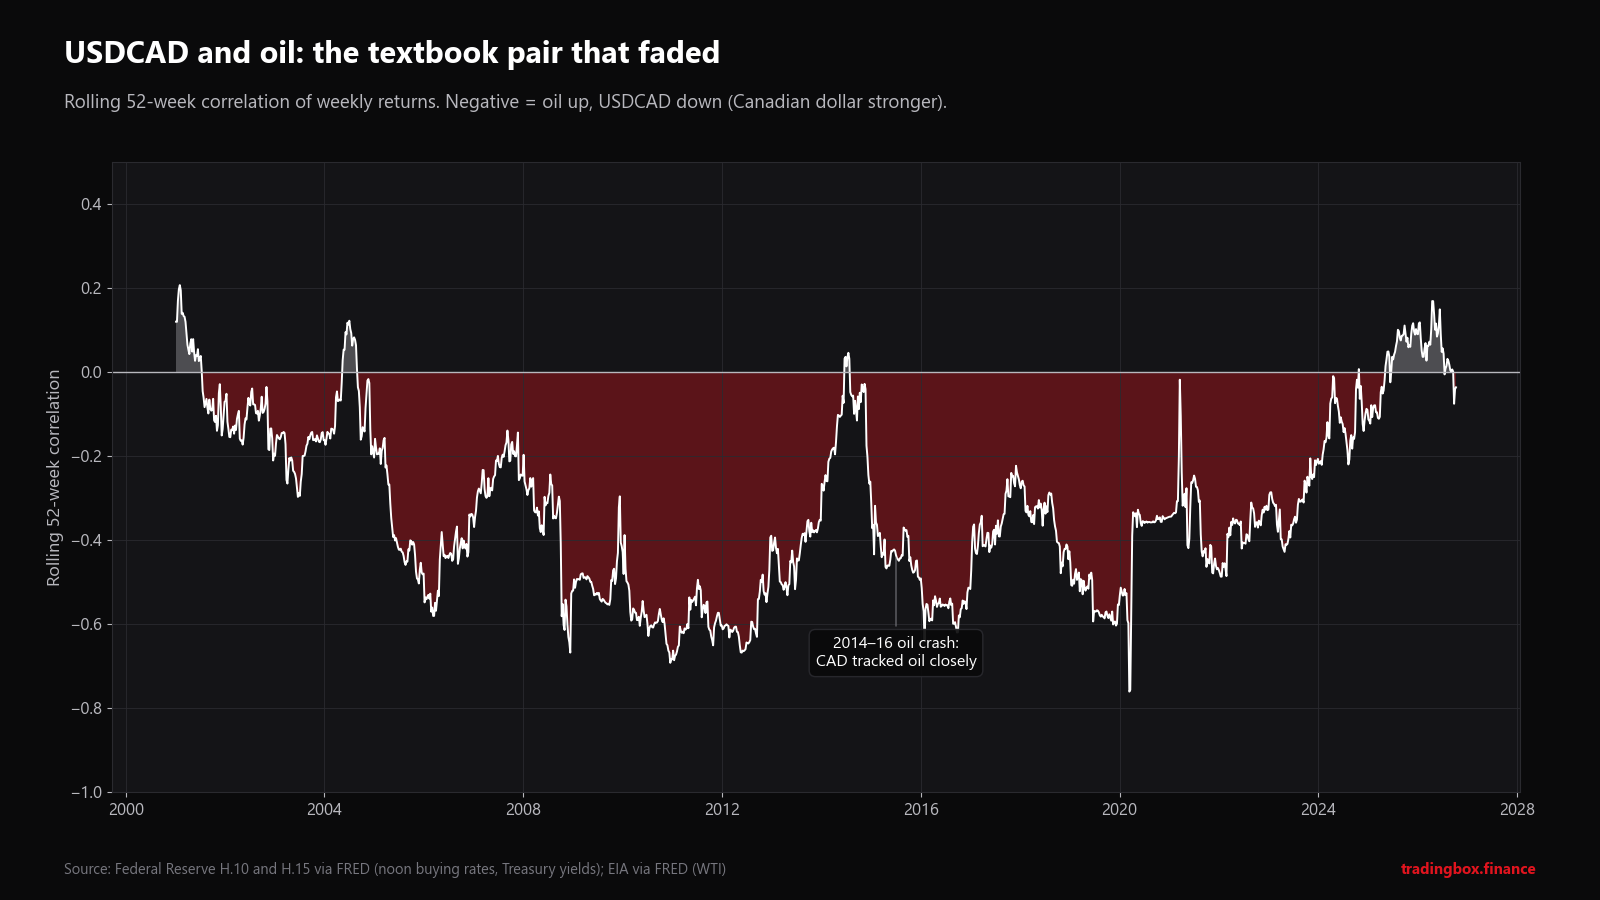
When it broke. In the last three years the weekly correlation was -0.09, +0.09 and -0.06: practically zero. The data shows the break clearly; the reasons are less certain. Likely contributors include the dominant role of interest-rate differences between the Bank of Canada and the Fed, US–Canada trade tensions in 2025, and changes in how Canadian oil revenues flow back into the currency.
What to look for. Do not assume oil will move CAD just because a book says so. Check the current rolling correlation first. If it is near zero, oil is not your edge on USDCAD right now.
6. AUD and industrial metals
Why it exists. Australia is the world's largest exporter of iron ore and a major exporter of coal, copper, gold and natural gas, much of it to China. Strong Chinese demand supports metal prices and the Australian dollar together.
How strong. Monthly correlations over 2000–2026: AUDUSD with copper +0.56, with gold +0.38, with iron ore +0.35. Copper is the best single proxy because it reflects global industrial demand and is traded in deep, transparent markets.
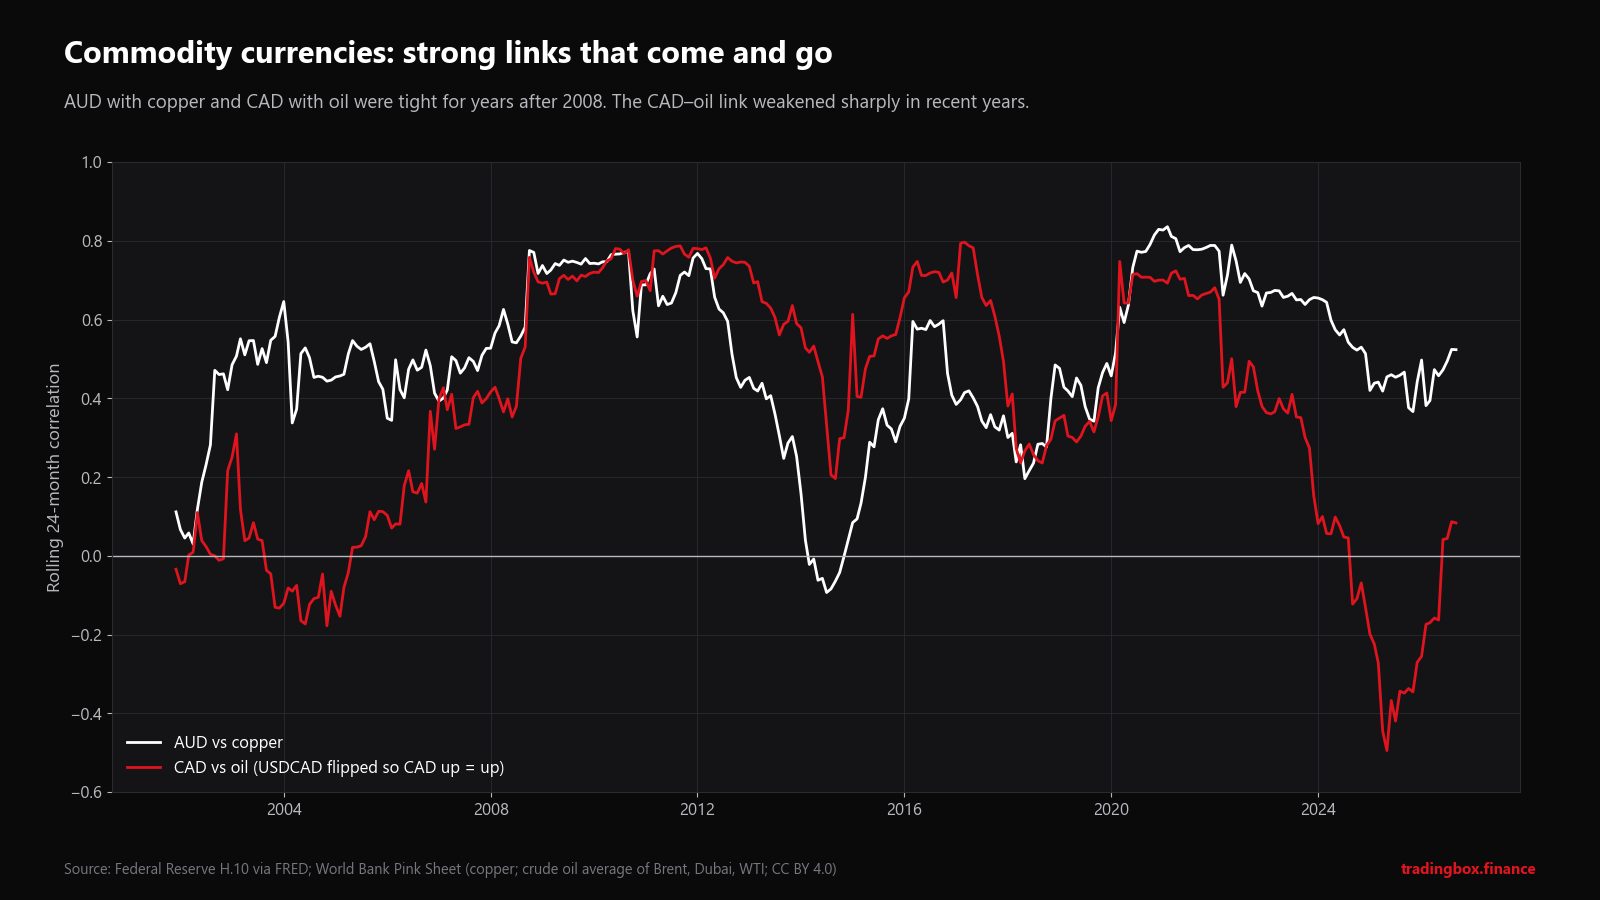
What to look for. Chinese data (industrial production, credit growth, property news) often moves copper and AUD at the same time. The link weakened in 2013–14 when the mining investment boom ended, and again in 2024–25, but it has never turned clearly negative.
7. Gold and silver
Why it exists. Both are precious metals priced in dollars and bought partly as stores of value. Silver also has large industrial uses (electronics, solar panels), which makes it more volatile and more sensitive to the economic cycle.
How strong. Monthly correlation +0.72 from 1973 to 2026, and the same +0.72 over the last ten years: one of the most stable correlations in this guide.
What to look for. The gold/silver ratio (how many ounces of silver buy one ounce of gold) was about 67 in September 2026 using World Bank monthly averages. Traders watch extreme readings of the ratio, but remember that a ratio can stay "extreme" for years.
8. Risk-on, risk-off
This is less a single correlation than a pattern that links many markets at once.
- Risk-on (calm markets, rising stocks): money tends to flow to higher-yielding and commodity currencies such as AUD, NZD and many emerging-market currencies.
- Risk-off (fear, falling stocks): money tends to flow to the US dollar, the Japanese yen, the Swiss franc and, often, gold.
In the heat map you can see part of this: gold correlates positively with EURUSD and AUDUSD and negatively with USDCHF and USDJPY, because a weaker dollar and a stronger yen and franc often come together in risk-off moods.
What to look for. In a sharp sell-off, many correlations jump toward ±1 at the same time. Positions that looked diversified suddenly behave like one trade. This is exactly when diversification is needed most and works least.
How to find and test a correlation yourself
Published correlation tables are everywhere. Most of them are calculated wrongly, on too few data points, or over one lucky period. Here is a method that avoids those problems.
Step 1. Start with a reason, not a search
Begin with an economic link you can explain in one sentence ("Canada exports oil, so CAD should rise with oil"). If you search hundreds of pairs for the highest number, you will find impressive correlations that are pure chance. With 100 random pairs, about 5 will look "statistically significant" by luck alone.
Step 2. Use returns, never prices
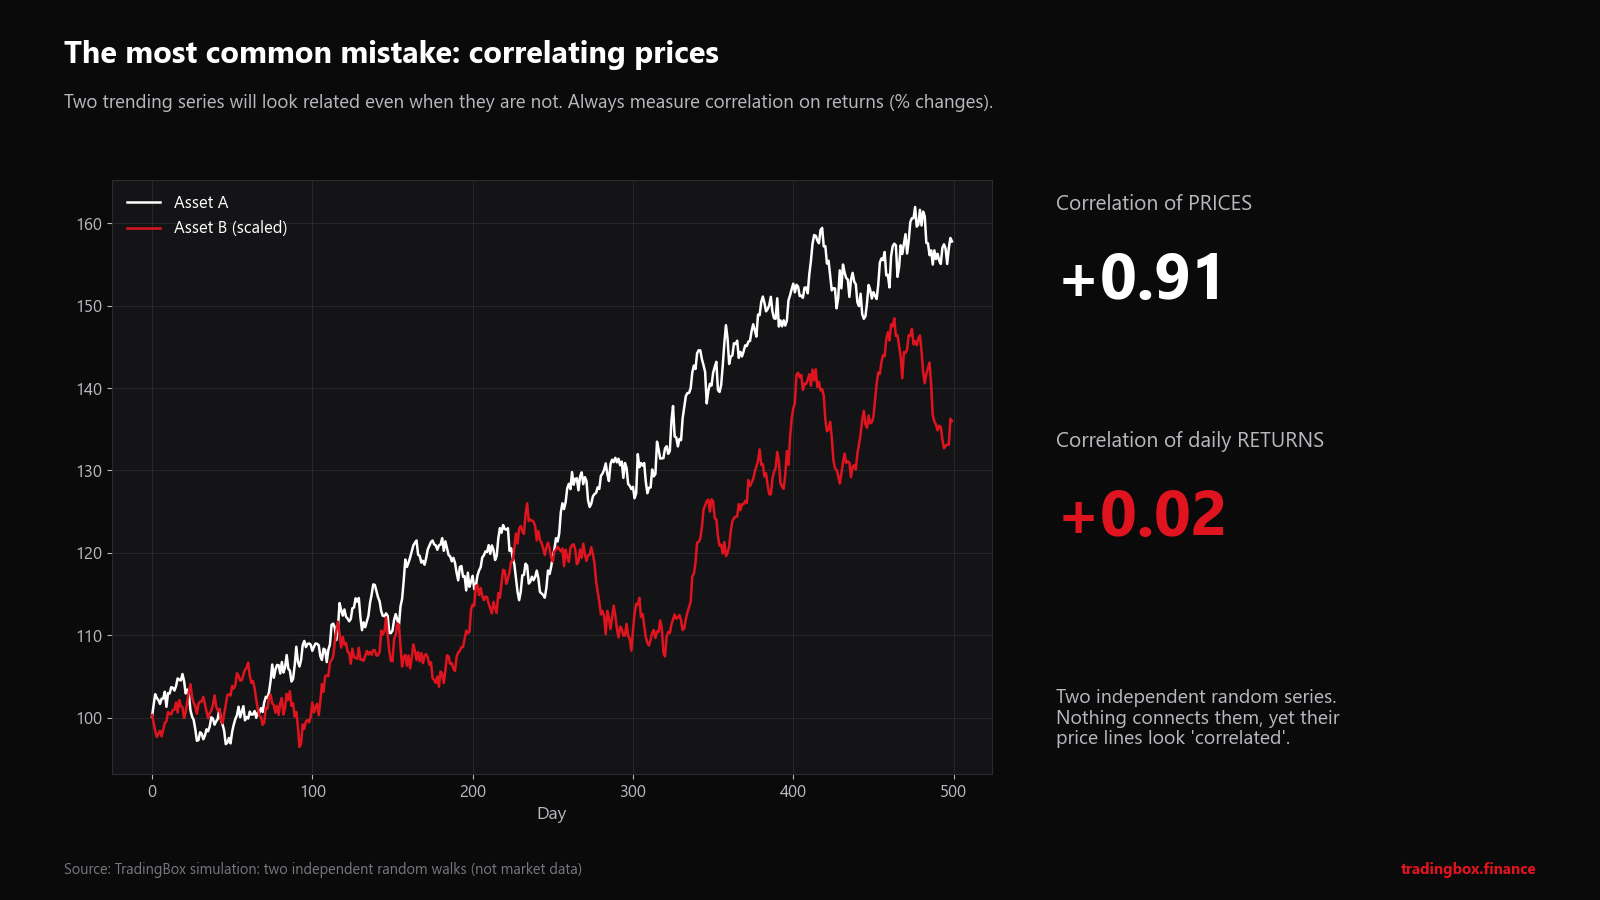
These two lines are completely independent random series that we generated. Nothing connects them. Yet because both drift upward, the correlation of their prices is +0.91. The correlation of their daily returns (the honest measure) is +0.02: no relationship at all.
This is the most common mistake in trading articles and indicator tools. Always calculate correlation on percentage changes (or log returns): =LN(today/yesterday).
Step 3. Line the data up correctly
- Use the same timestamps. Daily closes taken at different times (for example 5 pm New York for forex and a different exchange close for commodities) can hide or create correlations.
- For interest rates, use the change in points (e.g. 4.10% > 4.25% = +0.15), not the percentage change.
- Remove days when one market was closed.
Step 4. Measure more than one window
Calculate the correlation over a short window (about 60 days) and a long one (about 250 days or 3 years of months). When they disagree, the relationship is changing. That disagreement is often more useful than either number.
Step 5. Check stability across periods
Split your history into blocks (by year, or before and after a big event) and calculate the correlation in each. A real relationship keeps the same sign in most blocks. EURUSD–USDCHF was negative in every single year from 2000 to 2026. USDCAD–oil was not.
Step 6. Check that it is large enough to matter
As a rule of thumb, a correlation measured from n observations needs to be bigger than about 2 divided by the square root of n to be distinguishable from chance: 0.45 for 20 observations, 0.26 for 60, 0.13 for 250.
Step 7. Remember correlation is not a hedge ratio
Correlation says how consistently two markets move together. It does not say how much. Gold may be well correlated with silver while moving only half as much in percentage terms. To size a hedge you need beta (the slope of the regression line), which accounts for the different volatility of each market.
Step 8. Look for the common driver
Very often, two markets are correlated because a third thing moves both: US real rates (gold and the dollar), Chinese demand (AUD and copper), risk appetite (yen and stocks). If you find that driver, follow it directly. It usually gives you a cleaner picture than the correlation itself.
Checklist: what to look for before using a correlation
| Question | Good sign | Warning sign |
|---|---|---|
| Is there an economic reason? | You can explain it in one sentence | "It just works" |
| Measured on returns? | Yes | Calculated on prices |
| How many observations? | Hundreds | A few dozen or less |
| Same sign across years? | In most years | Flips often |
| Short vs long window | Similar | Very different |
| Held in place by a policy? | No | Peg, floor, cap, intervention |
| Big upcoming event? | None | Central bank meeting, election, referendum |
Practical uses
- Measure your real exposure. Long EURUSD, long GBPUSD and long gold is close to one large position against the dollar. Add up the risk before you add another trade.
- Avoid false hedges. A position "hedged" with a moderately correlated market (|r| around 0.4–0.6) still carries most of its risk.
- Read divergences. When two normally linked markets separate (AUD rising while copper falls, gold rising with the dollar), ask why. One of them is reacting to news the other is not.
- Prepare for the breaks. Correlations change most during crises and central bank surprises, exactly when risk is highest. Keep position size and stops based on each trade's own risk, not on an assumed hedge. Our lot size calculator and economic calendar help with both, and our guides to position size and trading around economic releases explain how.
Frequently asked questions
What is a good correlation for trading? There is no single number. For risk control, treat anything above about 0.6 in size (positive or negative) as "these trades largely overlap". Below about 0.3 the overlap is small. Always check how many observations the number is based on.
Which timeframe should I use? Daily or weekly returns for most traders. Intraday correlations are noisy and change quickly. Use the timeframe you actually hold positions on.
Can I find correlations in MetaTrader 5? MT5 has no built-in correlation tool. You can export prices (View > Symbols > Bars > Export) and use a spreadsheet's CORREL function on returns, as described above, or use a correlation indicator, after checking that it uses returns and not raw prices.
Do correlations predict prices? No. They describe how markets have moved together in the past. They are a tool for measuring risk, not a signal that tells you when to buy or sell.
Sources and method
- Exchange rates: Federal Reserve Board H.10 noon buying rates in New York (DEXUSEU, DEXUSUK, DEXSZUS, DEXJPUS, DEXUSAL, DEXUSNZ, DEXCAUS), via FRED.
- Interest rates: US Treasury constant-maturity yields, Federal Reserve H.15 (DGS2, DGS10), via FRED.
- Oil: WTI Cushing spot price (DCOILWTICO), US Energy Information Administration via FRED; and the World Bank average crude price (Brent, Dubai, WTI).
- Gold, silver, copper, iron ore: World Bank Commodity Price Data (The Pink Sheet), monthly averages, CC BY 4.0.
- Correlations: Pearson correlation of weekly (Friday) or monthly log returns; changes in percentage points for yields. Rolling windows and periods as stated on each chart. All calculations by TradingBox. The random-series example is a simulation, not market data.
- SNB minimum exchange rate: Swiss National Bank announcements of 6 September 2011 and 15 January 2015.
- This product uses the FRED® API but is not endorsed or certified by the Federal Reserve Bank of St. Louis.
This article is for education only. It is not investment advice, and past relationships between markets do not guarantee future ones. Trading leveraged products such as CFDs carries a high risk of losing money.
Trading involves risk. See the risk disclaimer.