
How to Calculate Position Size: Forex, Gold, Crypto
Most traders choose their lot size first and their stop second. Professionals do the opposite. They decide how much money they are willing to lose on the trade, place the stop where the trade idea is proven wrong, and only then calculate the lot size that connects the two.
This guide shows you exactly how to do that for forex, gold, indices and crypto, with worked examples you can check in MetaTrader 5. The second half shows, with simulations, why the risk you choose per trade matters more than almost anything else in your trading.
If you only want the number, use our free Lot Size Calculator. It does every calculation below in your browser. If you want to understand it, read on.
Key takeaways
- Position size = money at risk ÷ (stop distance × value per point of one lot). Everything else is detail.
- Decide the money at risk first (usually 0.5% to 2% of your balance), then the stop, then the lots. Never the other way round.
- Leverage and margin do not set your risk. Your stop distance and your lot size do.
- The same 1% risk means very different lot sizes on EURUSD, gold, US30 and Bitcoin, because one lot is a different amount of each.
- At 1% risk, ten losses in a row cost you about 10% of your account. At 5% they cost 40%. Losing streaks of eight or more are normal, even for winning strategies.
The formula in one picture
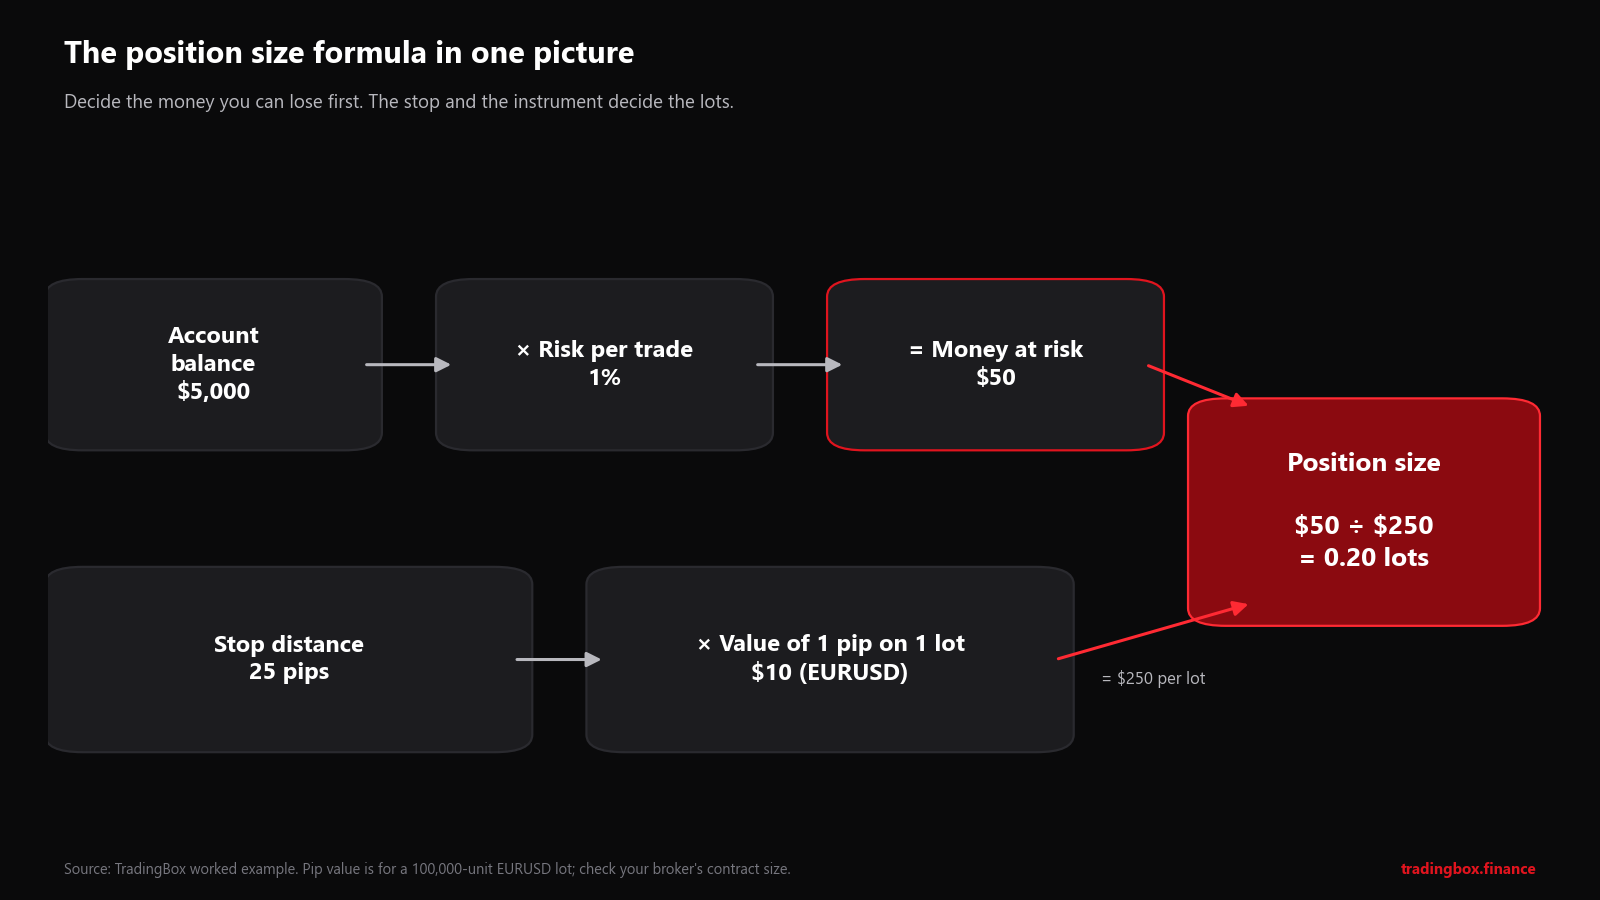
Example: a $5,000 account risking 1% on EURUSD with a 25-pip stop.
There are only three steps.
Step 1: money at risk. Balance × risk per trade. $5,000 × 1% = $50. This is the most you accept to lose if the stop is hit.
Step 2: risk per lot. Stop distance × the value of one pip (or one point) for one lot. On EURUSD one standard lot is 100,000 euros and one pip (0.0001) is worth $10. A 25-pip stop on one lot therefore risks 25 × $10 = $250.
Step 3: lots. Money at risk ÷ risk per lot. $50 ÷ $250 = 0.20 lots.
If the stop is hit you lose about $50, whatever the market does in between. If you want to risk less, you trade fewer lots. If your stop needs to be wider, you trade fewer lots. The stop goes where the chart says it should go, and the lot size adapts to it.
Always round down. If the formula says 0.267 lots and your broker's step is 0.01, trade 0.26, not 0.27. Rounding up quietly raises your risk on every trade.
Where the numbers come from in MT5
Every number you need is in your platform. In MetaTrader 5, open Market Watch, right-click the symbol and choose Specification. The important lines are:
| Field | What it means | Typical value |
|---|---|---|
| Contract size | How much of the asset one lot is | 100,000 (forex), 100 (gold), 1 (many crypto CFDs) |
| Digits | Decimal places of the price | 5 on EURUSD, 3 on USDJPY, 2 on gold |
| Tick size / tick value | Smallest price step and what it is worth on one lot | depends on the symbol and your account currency |
| Volume min / step | Smallest lot and the increment | 0.01 / 0.01 at most brokers |
The typical values are only typical. Brokers differ, especially on indices, metals and crypto. Always check the specification of the exact symbol you trade, on the account you trade it with.
A note on words: a pip is the fourth decimal on most pairs (0.0001) and the second on yen pairs (0.01). A point is the smallest price step your platform shows, so on a 5-digit EURUSD quote one pip is 10 points. On gold, indices and crypto, it is safer to think in price distance (for example "$15 on gold") than in pips, because brokers use the word differently.
Worked examples
All examples use a US dollar account of $5,000 and 1% risk ($50). Prices are rounded examples, not live quotes.
EURUSD (quote currency = your account currency)
- One lot = 100,000 EUR. One pip = 0.0001. Pip value on one lot = 100,000 × 0.0001 = $10.
- Stop: 25 pips. Risk per lot = 25 × $10 = $250.
- Lots = $50 ÷ $250 = 0.20.
This is the easy case: when the second currency of the pair is your account currency (EURUSD, GBPUSD, AUDUSD, NZDUSD with a USD account), one pip on one lot is always $10.
USDJPY (quote currency is not your account currency)
- One lot = 100,000 USD. One pip = 0.01 JPY. Pip value on one lot = 100,000 × 0.01 = ¥1,000.
- Convert to dollars at the current USDJPY price, say 158.00: ¥1,000 ÷ 158 = $6.33 per pip.
- Stop: 30 pips. Risk per lot = 30 × $6.33 = $189.90.
- Lots = $50 ÷ $189.90 = 0.263, rounded down to 0.26.
The pip value changes a little every time the price changes. For position sizing that is a rounding detail, but it is why a fixed "pip value table" is only ever approximately right.
EURGBP (a cross)
- Pip value on one lot = 100,000 × 0.0001 = £10.
- Convert at GBPUSD, say 1.333: £10 × 1.333 = $13.33 per pip.
- Stop: 20 pips. Risk per lot = $266.60.
- Lots = $50 ÷ $266.60 = 0.187, rounded down to 0.18.
Gold (XAUUSD)
- At most brokers one lot = 100 troy ounces, so a $1 move in the gold price = $100 per lot.
- Gold trades around $4,300 an ounce in autumn 2026, and a stop of $15 below a recent low is ordinary. Risk per lot = $15 × 100 = $1,500.
- Lots = $50 ÷ $1,500 = 0.033, rounded down to 0.03.
That surprises most new gold traders. With the same 1% risk you trade 0.20 lots of EURUSD but only 0.03 lots of gold, because one lot of gold moves about $100 for every dollar, and gold moves many dollars a day. Trading gold with "forex-sized" lots is one of the fastest ways to blow up a small account. Our gold lot size guide goes through it step by step.
If your broker's gold contract is not 100 ounces (some use 10 or 1), the formula is the same: use the contract size from the Specification window.
Indices (US30, NAS100, GER40...)
Index CFDs have no standard lot. One broker's US30 lot is $1 per index point, another's is $10, another's is $20.
- Suppose your broker's US30 specification says contract size 1, so one lot = $1 per point.
- Stop: 120 points. Risk per lot = $120.
- Lots = $50 ÷ $120 = 0.41.
At a broker where one lot = $10 per point, the same trade is 0.04 lots. Same chart, same stop, ten times fewer lots. This is the single most common sizing mistake on indices: copying lot sizes from someone who uses a different broker.
Bitcoin (BTCUSD)
- At many brokers one lot = 1 BTC, so a $1 move in the price = $1 per lot, and Bitcoin often moves thousands of dollars in a day.
- Stop: $1,500 away from entry. Risk per lot = $1,500.
- Lots = $50 ÷ $1,500 = 0.033, rounded down to 0.03.
Check the minimum lot. If it is 0.01 BTC and your stop is very wide, the smallest possible trade may already risk more than 1%. In that case the correct position size is no trade, not a bigger risk.
Summary table
| Instrument | Stop | Value of the stop on 1 lot | Lots for $50 risk |
|---|---|---|---|
| EURUSD | 25 pips | $250 | 0.20 |
| USDJPY (158.00) | 30 pips | $189.90 | 0.26 |
| EURGBP (GBPUSD 1.333) | 20 pips | $266.60 | 0.18 |
| Gold (100 oz) | $15 | $1,500 | 0.03 |
| US30 ($1/point) | 120 points | $120 | 0.41 |
| BTCUSD (1 BTC) | $1,500 | $1,500 | 0.03 |
Our Lot Size Calculator covers 31 instruments with editable broker settings, so you can type in your broker's exact contract size and lot step.
Leverage and margin are not risk
Many traders believe that higher leverage means higher risk. It does not, directly. Leverage decides how much margin your broker holds while the trade is open. Your risk is decided by lot size and stop distance.
Take the EURUSD trade above: 0.20 lots is 20,000 euros, about $22,400 of exposure at 1.12.
- With 30:1 leverage the broker holds about $747 of margin.
- With 500:1 leverage it holds about $45.
In both cases, if the 25-pip stop is hit, you lose $50. The leverage changed only how much of your balance is locked up.
So why do regulators limit leverage? Because high leverage allows traders to open positions far too big for their account. In 2018 the European Securities and Markets Authority capped retail leverage at 30:1 on major currency pairs, 20:1 on gold and major indices and 2:1 on crypto, after finding that 74–89% of retail CFD accounts lose money. Leverage is the loaded gun; position size is whether you point it at your foot.
What to do: calculate lots from your risk, then check that the margin needed is comfortably below your free margin. If it is not, the position is too big for the account, whatever the formula says.
What a losing streak does to your account
Every strategy has losing streaks. The question is not whether you will have one, but how much of your account will be left when it ends.
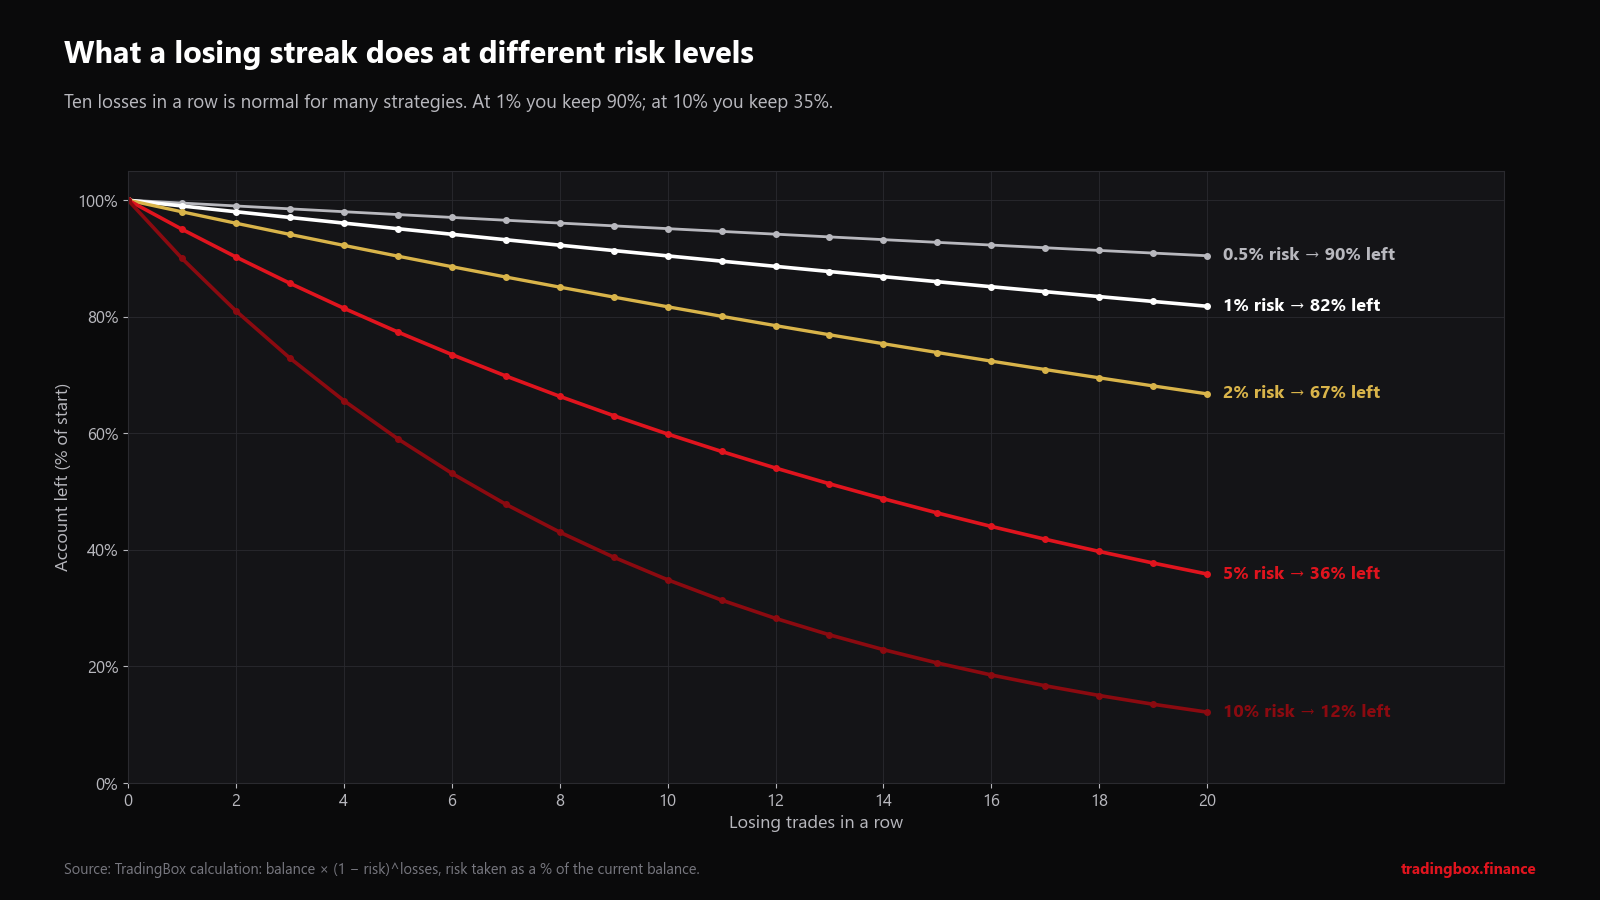
| Losses in a row | 1% risk | 2% risk | 5% risk | 10% risk |
|---|---|---|---|---|
| 5 | -4.9% | -9.6% | -22.6% | -41.0% |
| 10 | -9.6% | -18.3% | -40.1% | -65.1% |
| 15 | -14.0% | -26.1% | -53.7% | -79.4% |
How likely are long streaks? We simulated 100,000 sequences of 200 trades:
- With a 45% win rate, more than half (53%) had a streak of 8 or more losses, and one in five had 10 or more.
- Even with a 60% win rate, 39% had a streak of 6 or more losses.
That is pure probability, before bad days, news spikes or mistakes.
Why losses are harder to win back
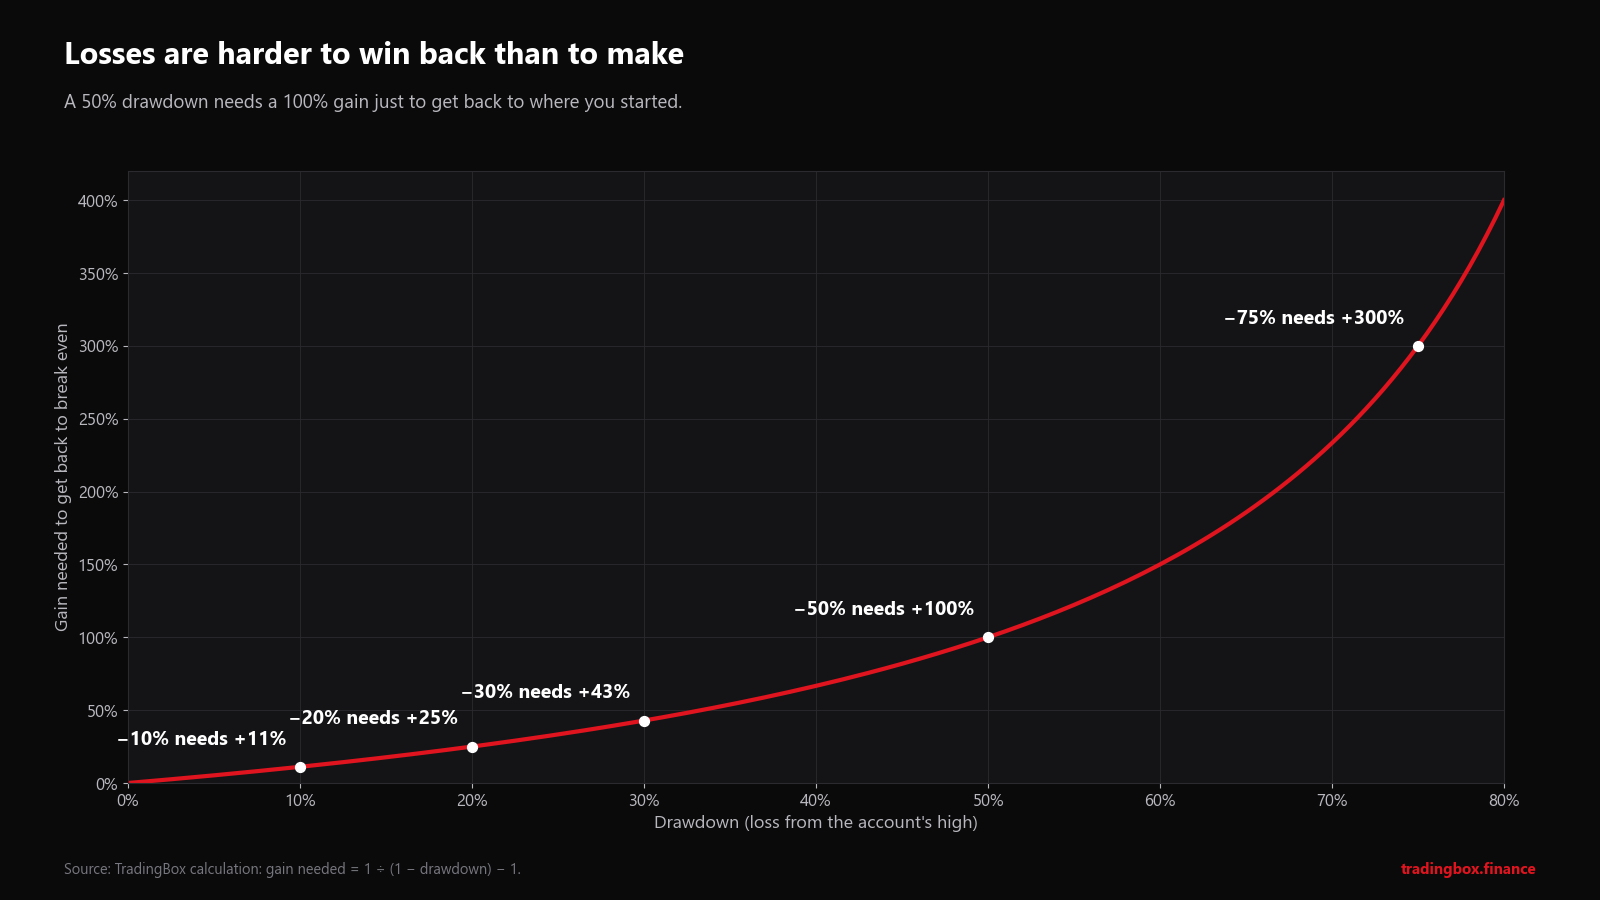
A 10% loss needs an 11% gain to recover. A 50% loss needs 100%. A 75% loss needs 300%. This asymmetry is why traders who survive for years nearly all risk small amounts per trade: a small drawdown is an inconvenience, a big one is a hole you may never climb out of.
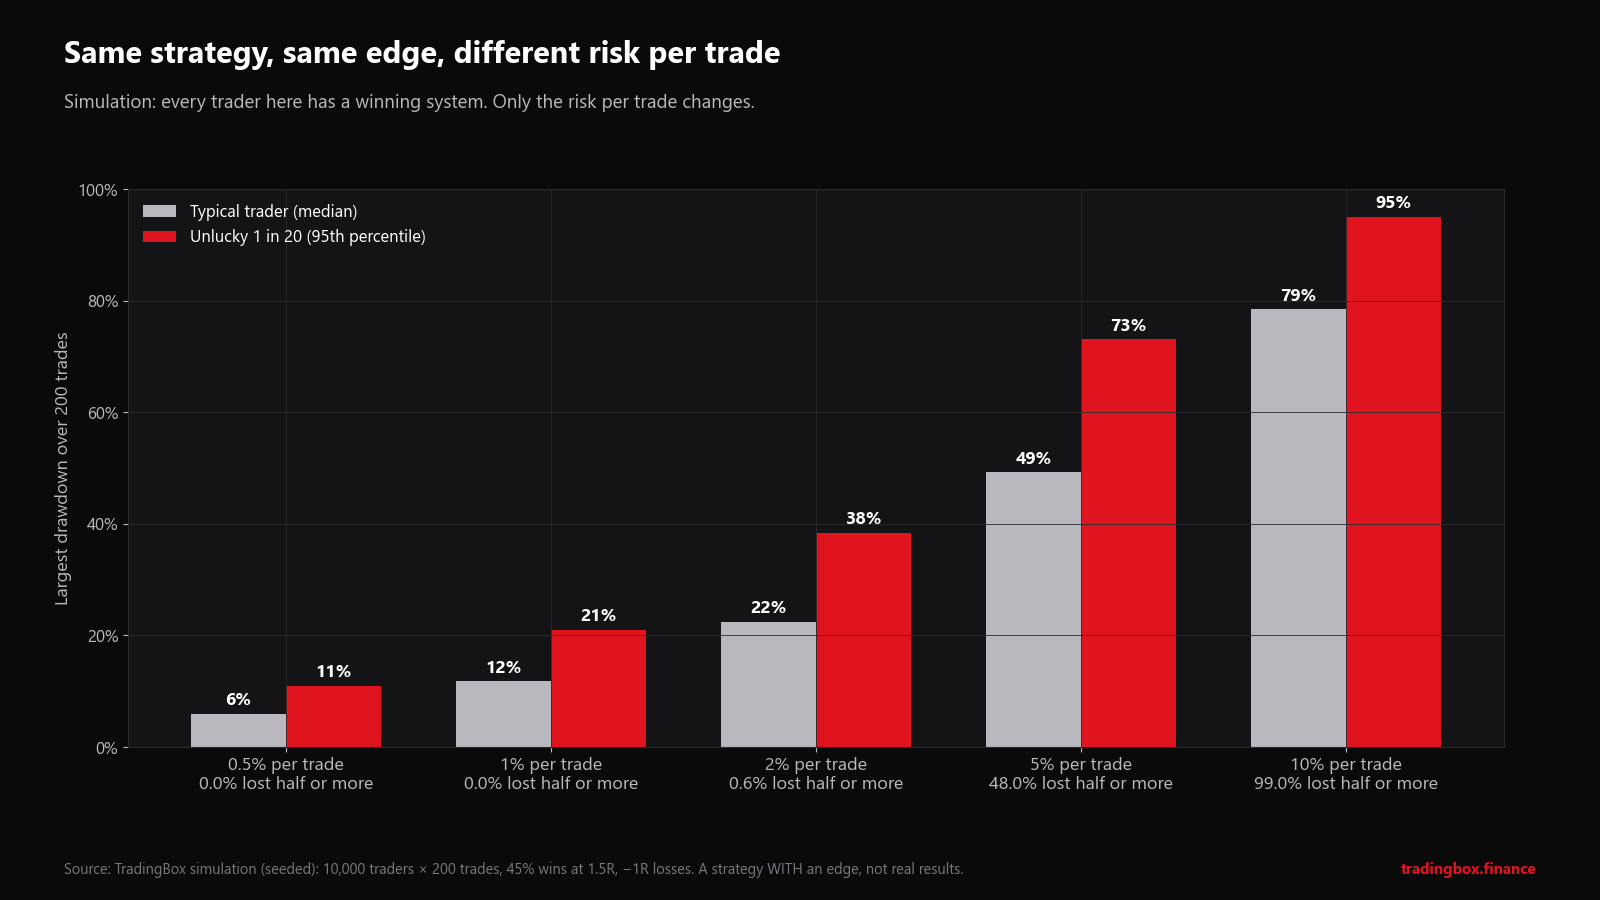
Same strategy, different risk: a simulation
To show how much the risk per trade matters on its own, we simulated 10,000 traders who all use the same profitable strategy: they win 45% of their trades, winners make 1.5 times what losers lose. Over time this strategy makes money. The only difference between the traders is the percentage they risk per trade.
| Risk per trade | Typical worst drawdown | Unlucky 1 in 20 | Traders who lost half their account or more |
|---|---|---|---|
| 0.5% | 6% | 11% | 0% |
| 1% | 12% | 21% | 0% |
| 2% | 22% | 38% | 0.6% |
| 5% | 49% | 73% | 48% |
| 10% | 79% | 95% | 99% |
Read the last column again. With a strategy that wins over time, nearly half of the traders risking 5% per trade still saw their account fall by half or more at some point in 200 trades, and almost every trader risking 10% did. Most of them would have stopped trading, changed strategy or added money long before the strategy's edge could show.
This is a simulation with a clean, constant edge, which real trading never has. Real results are usually worse, not better.
How much should you risk per trade?
There is no single right number, but there is a sensible range.
- 0.5% to 1%: the range most professional and prop-firm rules sit in. You can survive long streaks and keep a clear head.
- 1% to 2%: workable for an experienced trader with a tested strategy and a stable routine.
- Above 2%: drawdowns become large and emotional quickly. Above 5% the simulation above shows what usually happens.
Two adjustments matter in practice:
- Correlated trades add up. Buying EURUSD and GBPUSD at 1% each is closer to one 2% bet on the US dollar than to two separate trades. Our forex correlations guide shows which pairs move together and by how much.
- Include costs. Spread and commission are part of the loss if the stop is hit. On a tight stop they can be 10–20% of the risk, so add them to the stop distance when you size the trade.
Small accounts
With a $500 account, 1% risk is $5. On EURUSD with a 25-pip stop that is 0.02 lots, which works. With a $100 account, 1% is $1, and the formula says 0.004 lots, below the usual 0.01 minimum. The smallest possible EURUSD trade (0.01 lots) with a 25-pip stop already risks $2.50, or 2.5%.
That is not a reason to risk 10% per trade. It is a reason to use tighter but honest stops, trade smaller instruments if your broker offers micro contracts, or practise on a demo account until the account is large enough for the risk rules to work.
Common position sizing mistakes
- Fixed lot size for every trade. 0.10 lots with a 10-pip stop and 0.10 lots with a 60-pip stop are two completely different risks.
- Moving the stop to fit the lot size. The stop belongs where the trade idea is wrong, not where the money runs out.
- Copying lot sizes from someone else. Different balance, different broker contract, different risk.
- Ignoring the yen and the crosses. Pip value is not $10 on every pair.
- Treating gold and indices like forex. One lot of gold moves about ten times more dollars per day than one lot of EURUSD.
- Forgetting open trades. Three open trades at 2% each is 6% at risk on your account at once.
- Raising risk after losses to win it back quickly. That is how a normal drawdown becomes a blown account.
Frequently asked questions
Is lot size the same as position size? Position size is how much you trade. Lots are the unit MetaTrader uses to express it. One lot is a different amount for each instrument, which is why the same position size in dollars of risk gives different lot numbers.
What is the position size formula? Lots = (balance × risk %) ÷ (stop distance × value per pip or point of one lot).
Does the formula work for selling (short) trades? Yes. The stop distance is measured from your entry to the stop, above the price for a sell. Remember that a sell is closed at the ask price, so the spread is part of the distance.
How do I size a position without a stop loss? You can't, in any meaningful way. Without a stop there is no defined loss, so there is nothing to divide. A "mental stop" works only if you are certain you will act on it.
Can I let an EA calculate the lot size? Yes, and a well-built Expert Advisor should do exactly this calculation on every trade from the symbol's own tick value, so it works on any broker. If you need one built that way, see our custom EA development service.
Next steps
- Use the free Lot Size Calculator before your next trade. Everything is calculated in your browser and nothing you type is stored.
- Position sizing, risk per trade and writing a trading plan are core modules of our Trading Beginner Course (coming soon: press Notify me to hear when it opens).
- Read next: How to backtest a trading strategy, to find out whether your strategy has an edge worth risking 1% on.
Sources
- European Securities and Markets Authority: ESMA adopts final product intervention measures on CFDs and binary options (2018; leverage limits and the 74–89% figure).
- MetaQuotes: MetaTrader 5 Help, symbol specification.
- Losing-streak, drawdown and Monte Carlo figures: TradingBox calculations and seeded simulations (100,000 and 10,000 runs), described next to each chart.
This article is education, not financial advice. Trading forex, metals, indices and crypto on margin carries a high risk of losing money. Examples use rounded example prices; check your broker's contract specifications before trading.
Trading involves risk. See the risk disclaimer.