
How to Backtest a Trading Strategy, Step by Step
A backtest answers one question: if I had followed these exact rules in the past, what would have happened? Done well, it is the cheapest way to throw away bad ideas before they cost you money. Done badly, it is the most convincing way to fool yourself.
This guide walks through backtesting step by step, manual and automated, with the MetaTrader 5 Strategy Tester settings that matter. Then we run three real tests on 26 years of EURUSD data to show the traps that make most backtests look far better than the future turns out.
Key takeaways
- Write the rules so precisely that a computer, or a stranger, could follow them with no questions. If you can't, you are not ready to backtest.
- Keep data aside. Design and tune the strategy on one period, then test it once on a period you never looked at.
- In our test, the best of 224 moving-average settings made +128% on the data used to choose it, then +0.6% over the following 11 years. 62% of the settings it "beat" did better afterwards.
- Luck looks like skill. Out of 500 strategies that chose their direction by flipping a coin each week, the best one nearly doubled its money.
- Include spread, commission and slippage. On a faster strategy, going from 0 to 3 pips of cost cut a 26-year result from +45% to +27%.
What a backtest can and cannot tell you
It can tell you:
- whether the rules had any edge at all in the past,
- how often they win, how big the wins and losses are,
- the worst drawdown and the longest losing period,
- how sensitive the result is to costs and settings.
It cannot tell you that the future will look like the past. Markets change. The goal of a backtest is not to prove a strategy works; it is to try hard to prove it doesn't, and see if it survives.
Step 1: Write the rules completely
Every rule needs a precise answer:
- Entry: which instrument, which timeframe, what exact condition, at what price (next bar open? a limit order?).
- Exit: stop loss, take profit, trailing stop, time exit, opposite signal.
- Size: fixed lots or a risk percentage. Our position size guide shows how to calculate it.
- Filters: trading hours, spread limit, news days, maximum open trades.
"Buy when the trend is up and momentum is strong" is not a rule. "Buy at the next H1 bar open when the close is above the 200-period simple moving average and the 14-period RSI crosses above 50" is.
Step 2: Choose your data and split it
You need enough history to include different market conditions: trends, ranges, high and low volatility, at least one crisis. For a daily strategy that usually means 10+ years; for an intraday strategy, at least 2–3 years and hundreds of trades.
Then split it:
- In-sample (for example the first 70%): where you design and tune.
- Out-of-sample (the last 30%): locked away until the very end, used once.
If you look at the out-of-sample results, change something, and test again, it is no longer out-of-sample.
Step 3: Model costs honestly
Include:
- Spread, and not just the typical one: spreads widen at the daily rollover, on Monday mornings and around news.
- Commission per lot, if your account charges one.
- Slippage on stops and market orders, especially on fast moves.
- Swap (overnight financing) if trades are held for days.
When in doubt, use costs that are slightly worse than you expect. A strategy that only works with perfect costs does not work.
Step 4: Run the test
Manual backtesting
Scroll back on the chart, hide the future, and move forward one bar at a time. At each bar, decide exactly as your rules say, and record the trade in a spreadsheet: date, entry, stop, target, exit, result in R (multiples of your risk).
It is slow, but it is the best way to find out whether your rules are really complete, and it builds the screen time that automated tests can't. A replay tool helps a lot: our MT5 Candle Replay EA replays history bar by bar inside MetaTrader 5 and lets you place trades with custom lot sizes and indicators as you go.
Automated backtesting in the MT5 Strategy Tester
If the rules are coded as an Expert Advisor, MetaTrader 5 can test years of data in minutes. Open the tester with View › Strategy Tester (Ctrl+R), or right-click the EA in the Navigator and choose Test. Then set:
| Setting | What to choose |
|---|---|
| Expert | Your EA |
| Symbol and timeframe | The ones it was designed for |
| Date range | Your in-sample period first |
| Modelling | See below |
| Deposit and leverage | Close to your real account |
| Delays | "Random delay" to simulate a slower connection |
| Forward | "1/3" or "1/4" to keep the last part of the period as an automatic out-of-sample test |
The modelling mode decides how prices are simulated inside each bar:
| Mode | How it works | Use it for |
|---|---|---|
| Every tick based on real ticks | Uses the broker's recorded tick history | Final checks, scalping and tight stops (most accurate, slowest) |
| Every tick | Generates ticks from 1-minute bars | Most testing |
| 1 minute OHLC | Uses only the open, high, low and close of each 1-minute bar | Quick estimates and first optimisation runs |
| Open prices only | Runs only at the start of each bar | Strategies that only act at bar open; fastest |
A strategy with tight stops can look profitable on "1 minute OHLC" and lose on real ticks, because inside a minute the price can touch your stop before your target. Always confirm on the most realistic mode before you trust a result.
Need to install the EA first? See how to install an Expert Advisor in MT5. For every tester setting and report line, see our MT5 Strategy Tester guide.
Step 5: Read the right numbers
| Metric | What it tells you | Watch out for |
|---|---|---|
| Number of trades | How much evidence you have | Fewer than ~100 trades: results are mostly noise |
| Net profit after costs | The bottom line | Meaningless without the drawdown next to it |
| Maximum drawdown | The worst fall from a peak | Could you really sit through it with real money? |
| Profit factor | Gross profit ÷ gross loss | Above 1 means profitable; very high values often mean overfitting |
| Average win / average loss | The shape of the strategy | A high win rate with tiny wins and huge losses is fragile |
| Longest losing streak | The psychological test | Expect a longer one live |
| Results by year | Consistency | One great year carrying the whole test |
Step 6: Stress-test it
Before you believe a result, try to break it:
- Change the settings slightly. If 50/200 works but 45/200 and 55/200 don't, the result is luck, not a pattern.
- Test other symbols with similar behaviour.
- Double the costs.
- Remove the best 5 trades. Is it still profitable?
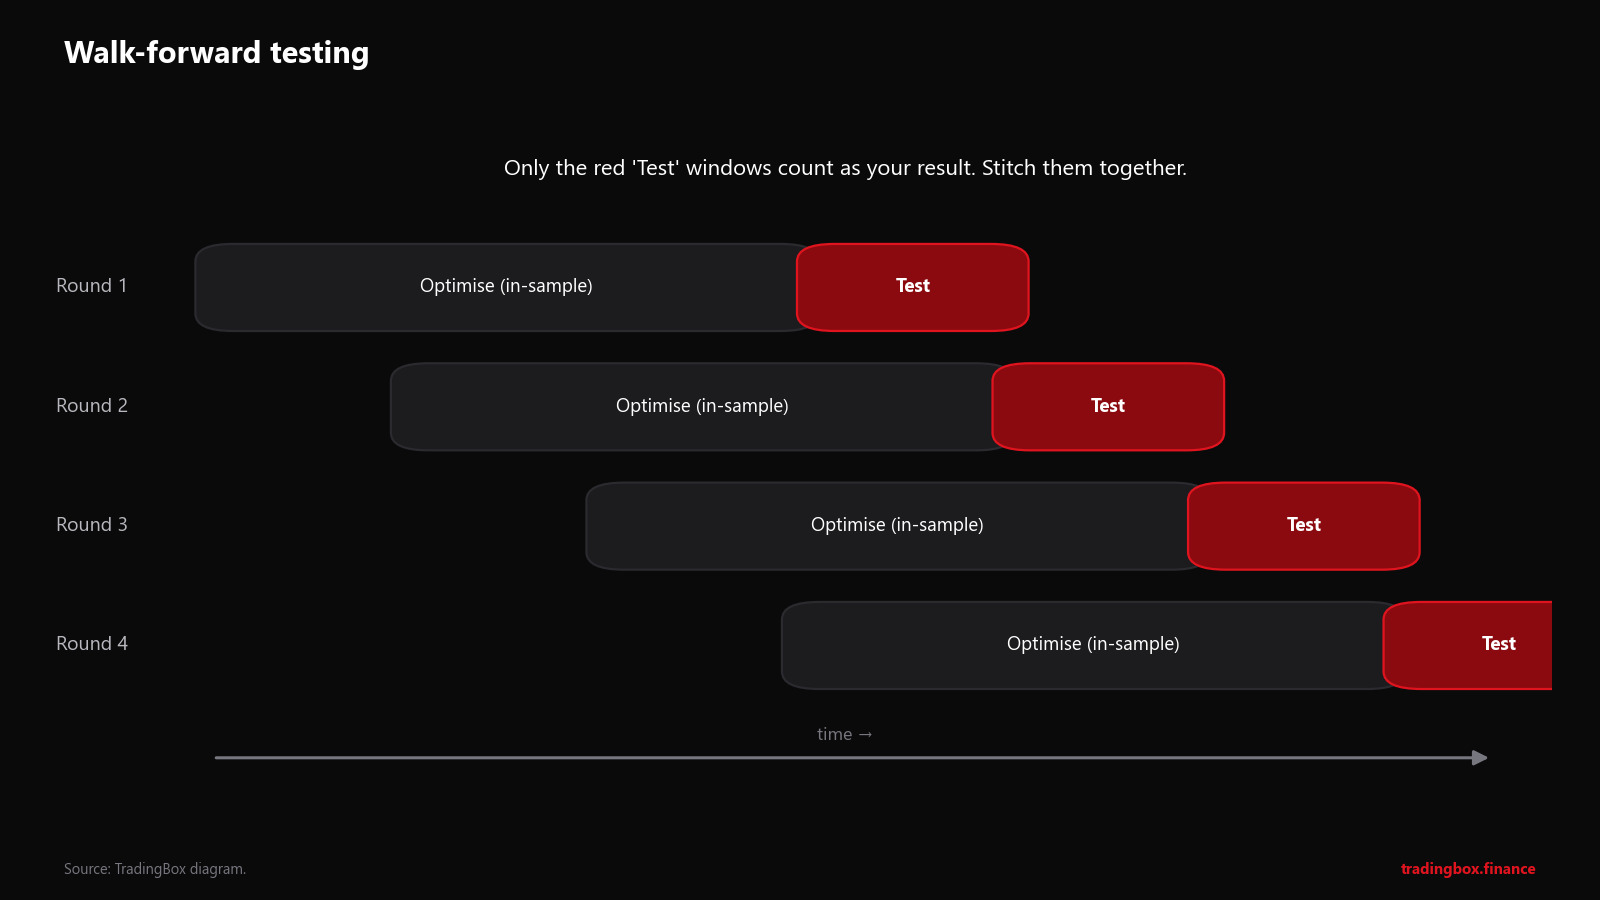
- Walk forward: optimise on one window, test on the next, move forward and repeat. Only the test windows count.
Step 7: Forward test on demo
A strategy that survived steps 1 to 6 goes on a demo account for weeks, ideally with the broker you will use live. Compare every demo trade with what the backtest would have done on the same days. Big differences mean something in your model of costs or execution is wrong.
Only then go live, at minimum size.
Trap 1: overfitting, shown with real data
Overfitting means tuning a strategy until it fits the past so well that it has learned the noise instead of a lasting pattern.
We took the classic moving-average crossover on daily EURUSD (always in the market, long when the fast average is above the slow one, short when below, 1.5-pip spread) and tried 224 combinations of fast and slow averages on 2003–2014. Then we picked the winner, as most traders would, and ran it on 2015–2026, data it had never seen.
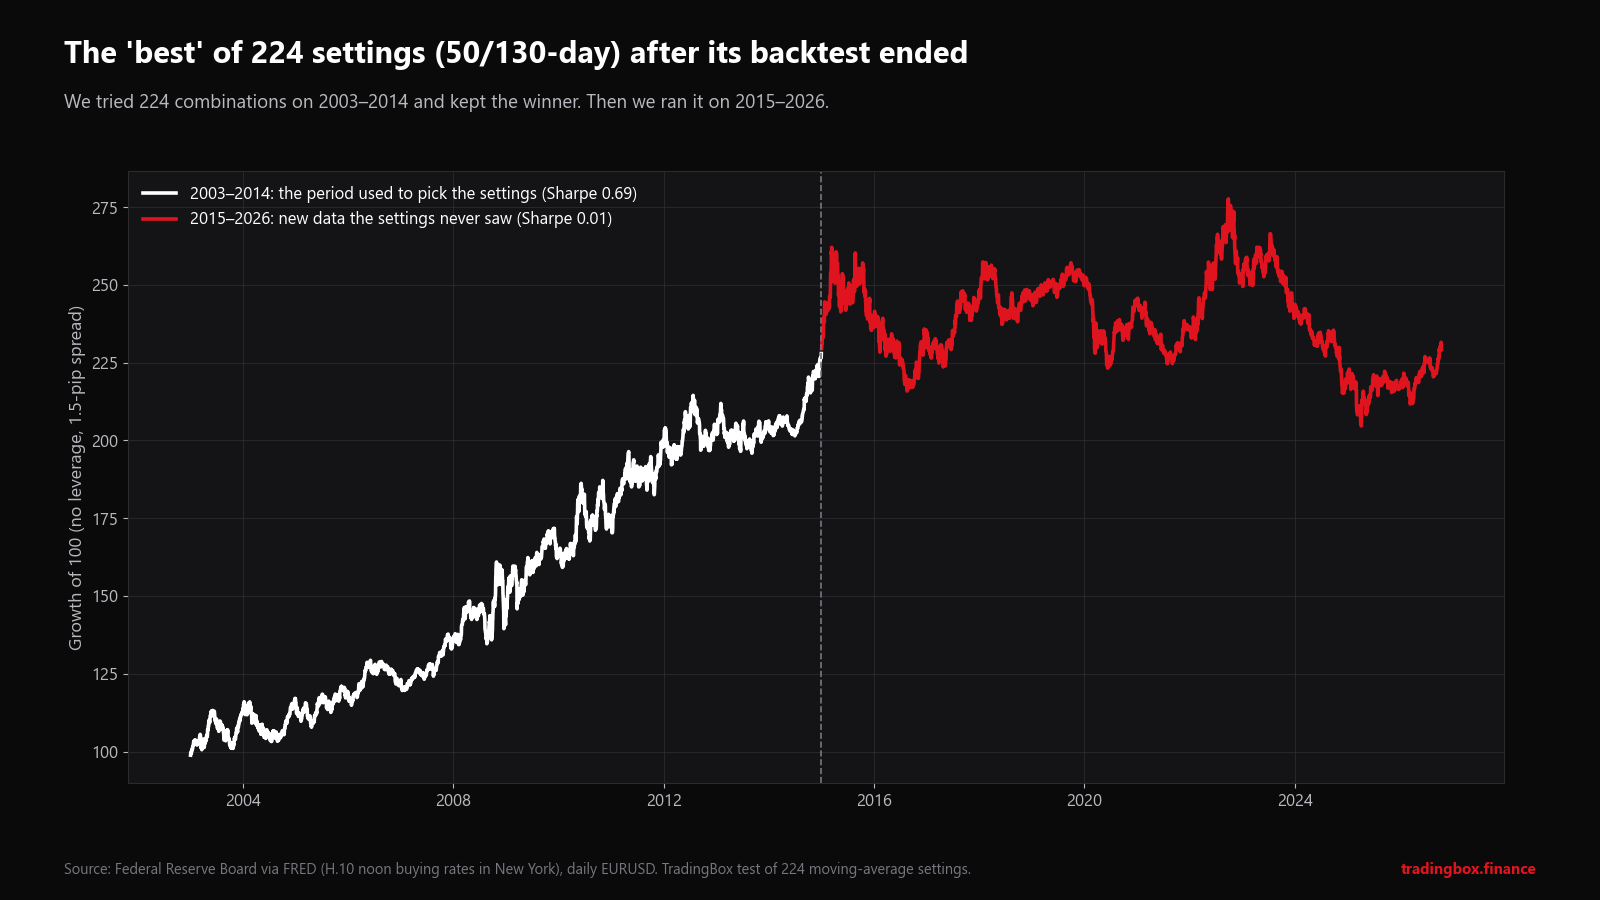
- 2003–2014 (used to pick it): +128%, a smooth rising line.
- 2015–2026 (new data): +0.6% in eleven years.
- 62% of the other 223 settings did better than the "winner" in the second period.
Was being the best in the past a useful guide at all? Here is every setting:
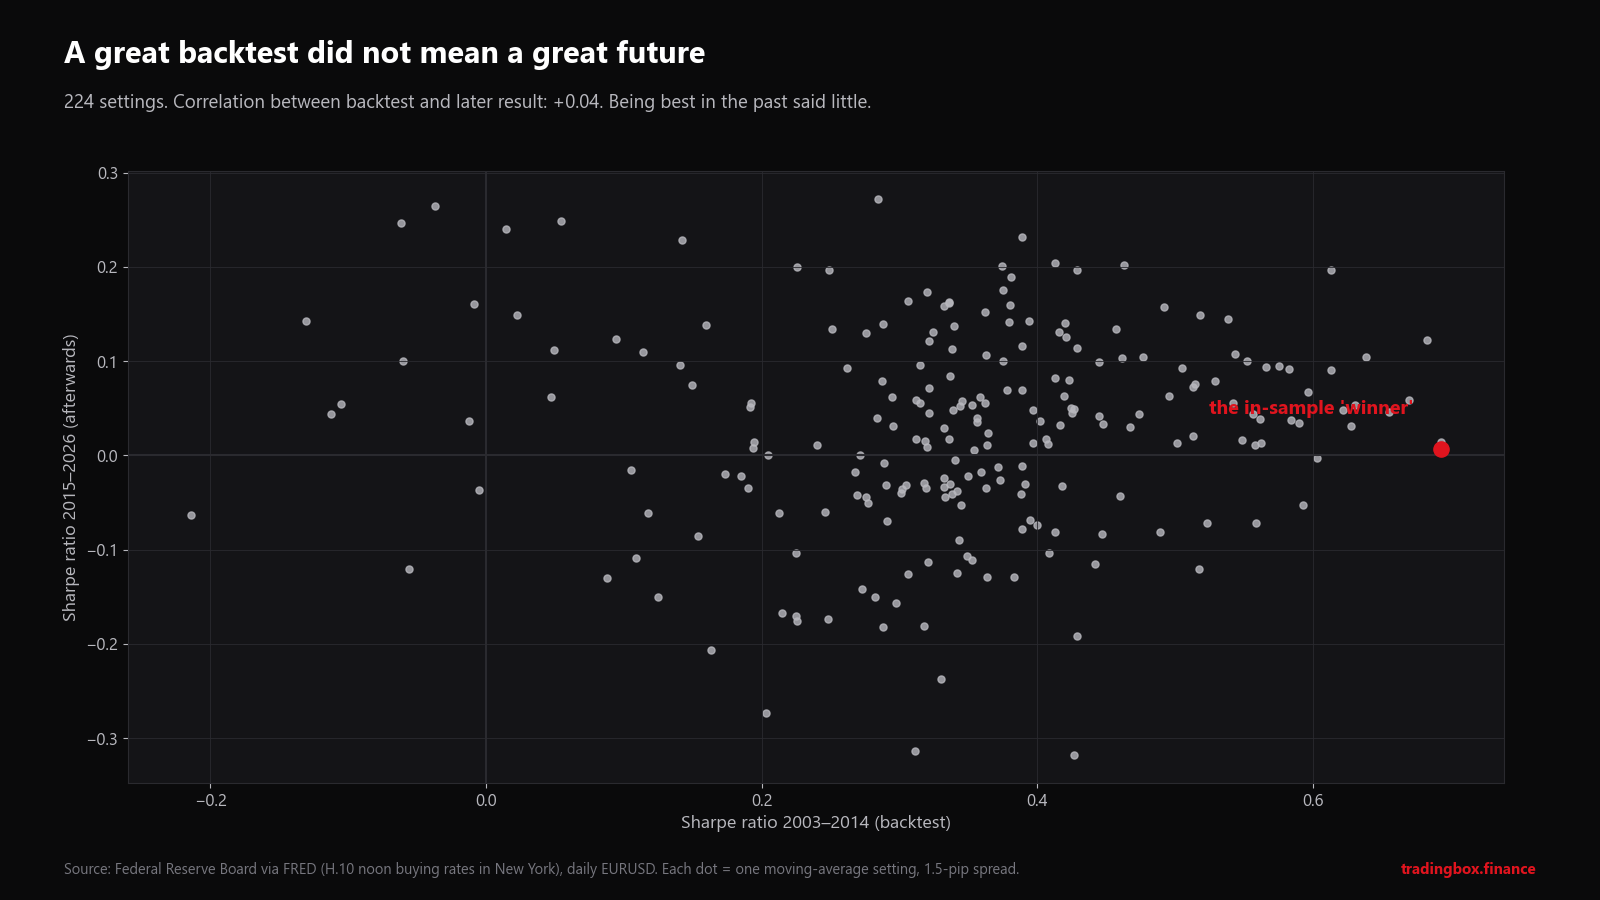
The correlation between a setting's backtest quality and its later quality was +0.04: practically zero. In this test, choosing the best backtest was no better than choosing at random.
This is not a special case. Academic research on the probability of backtest overfitting (Bailey, Borwein, López de Prado and Zhu, Journal of Computational Finance) shows that the more variations you try, the more likely your best result is a statistical accident, and that ordinary hold-out tests often fail to catch it.
How to protect yourself: decide the logic before you look at results, test few variations, prefer settings that sit in a broad "plateau" of good results rather than a single peak, and keep a true out-of-sample period.
Trap 2: luck looks like skill
To show how much results vary by pure chance, we created 500 strategies with no logic at all: each one chose long or short EURUSD by flipping a coin every week, from 2016 to 2026.
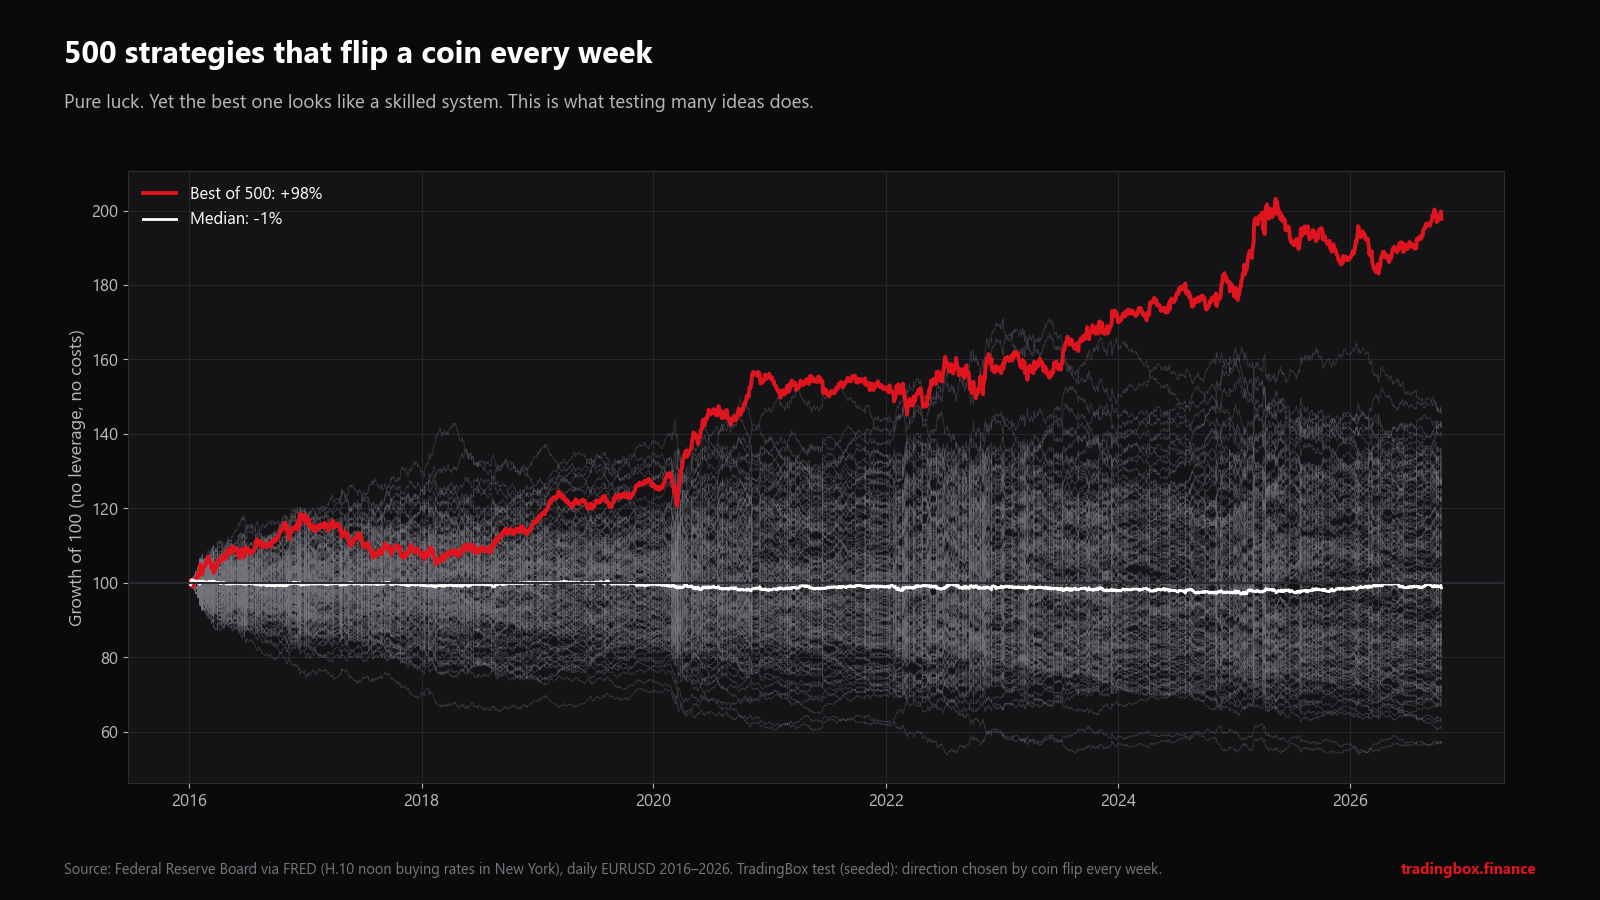
- The median strategy ended at about -1%, as you would expect.
- The top 10% made +32% or more.
- The best one made +98%, with a chart that looks like a skilled trend-following system.
Now imagine 500 traders, or 500 robots for sale, each showing only their result. The best ones would look brilliant, and none of them would have any edge. That is why a single impressive equity curve proves very little, and why you need many trades, an out-of-sample test and an explanation of why the strategy should work.
Trap 3: costs
Faster strategies trade more, and every trade pays the spread. We ran a 10/30-day crossover on daily EURUSD from 2000 to 2026, about 270 position changes, with four different spreads:
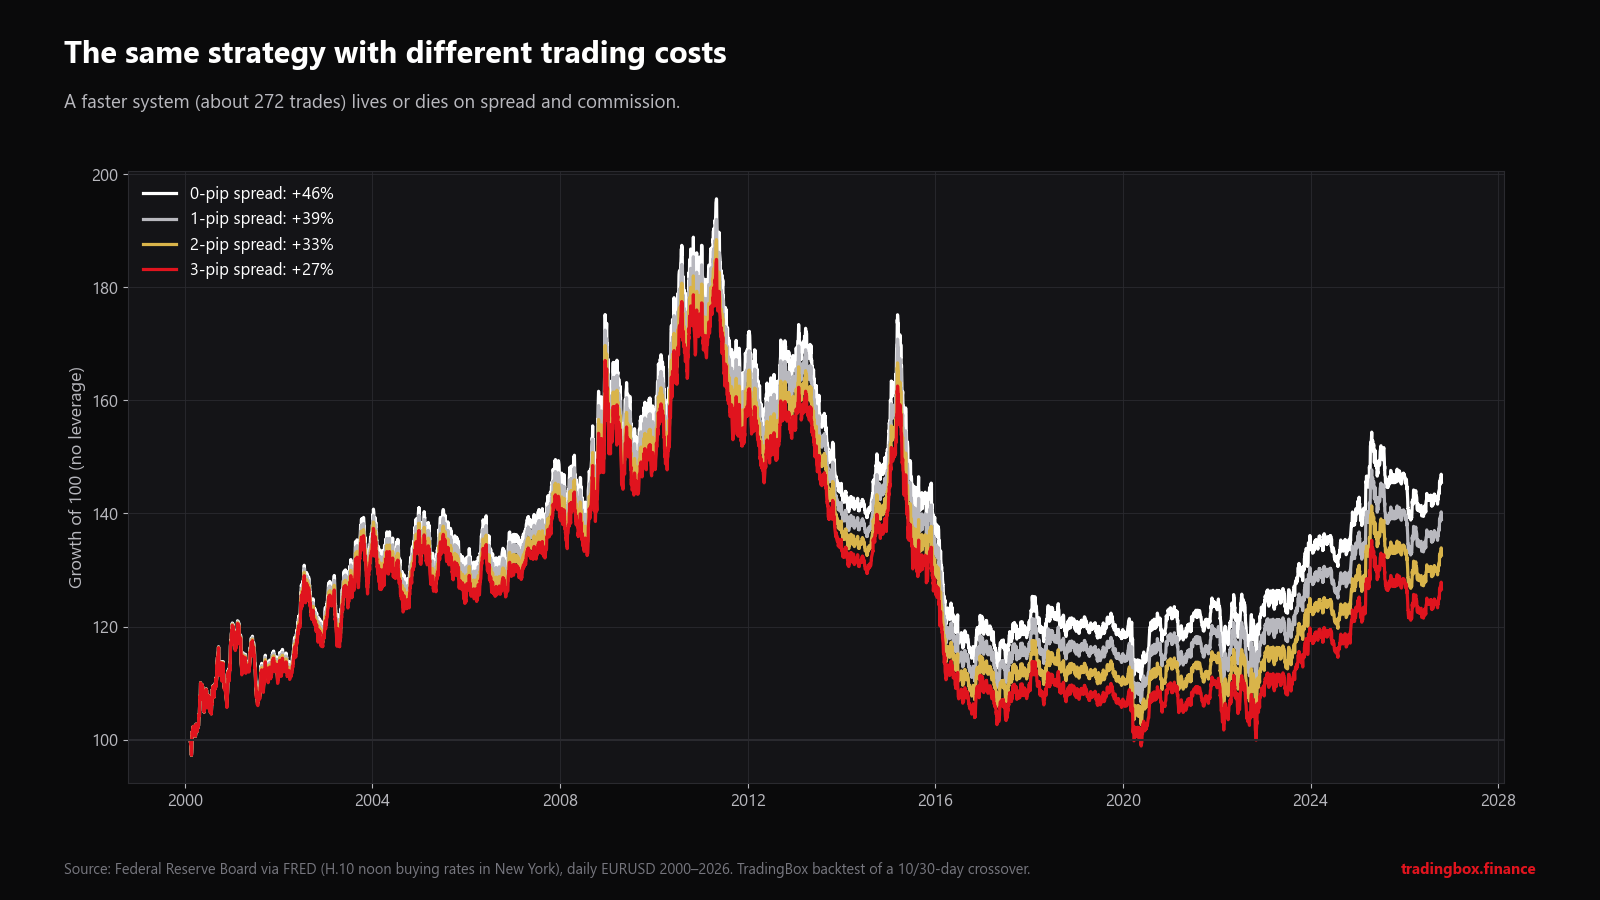
| Spread per trade | Result 2000–2026 |
|---|---|
| 0 pips | +45% |
| 1 pip | +39% |
| 2 pips | +33% |
| 3 pips | +27% |
On a daily system the damage is moderate. On an intraday system with 10–20 times more trades, the same costs can turn a winning backtest into a losing one. That is why scalping results from "zero spread" backtests are close to meaningless.
Other traps
- Look-ahead bias: using information that was not available at the time, like the day's close to decide a trade at the open. In code, always act on the next bar.
- Too few trades: 30 trades can look like anything. Aim for hundreds.
- One market regime: a strategy tested only on 2020–2021 has only seen one kind of market.
- Unrealistic fills: limit orders that are always filled, stops that never slip.
- Changing the rules mid-test because of a few losses. Write down every change you make.
Frequently asked questions
How much data do I need to backtest? Enough for at least 100 trades and more than one type of market. For daily strategies, usually 10 years or more; for intraday, several years.
Is manual or automated backtesting better? Both. Manual testing makes sure the rules are complete and teaches you how the strategy feels. Automated testing gives you thousands of trades and exact statistics. Many traders do 30–50 manual trades first, then code it.
What is a good profit factor? Above 1.0 is profitable; between about 1.3 and 2 is common for sound strategies after costs. Values far higher, especially with few trades, are more often a sign of overfitting than of a great system.
Why do my live results differ from my backtest? Usually costs, slippage, execution, a change in market conditions, or overfitting. Compare live and backtest trade by trade to find out which.
What is forward testing? Running the strategy on new data, either a held-back period in the tester (MT5's "Forward" option) or in real time on a demo account, without changing it.
Can TradingView backtest too? Yes. Pine Script strategies have a built-in tester. It is quick for ideas, but check how it fills orders and include commission and slippage in the strategy settings.
Next steps
- Practise manual backtesting on real MT5 history with the MT5 Candle Replay EA.
- Learn the Strategy Tester step by step in our free MetaTrader 5 Interface course, or write testable strategies in Pine Script A–Z and Python for Trading A–Z (coming soon: press Notify me).
- Have a strategy you want coded as an EA so you can test it properly? See custom EA development.
- Read next: AI trading bots vs MT5 Expert Advisors, and how to check a robot's backtest before you trust it.
Sources
- Federal Reserve Board, H.10 daily noon buying rates (EURUSD), via FRED, series DEXUSEU. All tests: TradingBox calculations with the rules, periods and costs described above; the coin-flip test is a seeded simulation on real prices.
- MetaQuotes: MetaTrader 5 Help, Strategy Tester (modelling modes, delays, forward testing).
- D. H. Bailey, J. M. Borwein, M. López de Prado and Q. J. Zhu, The Probability of Backtest Overfitting, Journal of Computational Finance.
This article is education, not financial advice. Backtested and simulated results have well-known limitations and do not guarantee future results. Trading on margin carries a high risk of losing money.
Trading involves risk. See the risk disclaimer.