
MT5 Strategy Tester: A Beginner's Guide
The Strategy Tester is built into every copy of MetaTrader 5. It runs an Expert Advisor on historical prices as if it were trading live, and produces a full report: profit, drawdown, every trade, a balance chart. It can also try thousands of input combinations to find the best ones, which is both its most powerful feature and its biggest trap.
This guide walks through it step by step. For the bigger picture of what makes a backtest trustworthy, read How to Backtest a Trading Strategy.
Key takeaways
- Open it with View › Strategy Tester (Ctrl+R), or right-click an EA in the Navigator and choose Test.
- Use "Every tick based on real ticks" for any final check, especially for strategies with tight stops.
- Turn on Random delay and use realistic spread and commission, or the results will be better than reality.
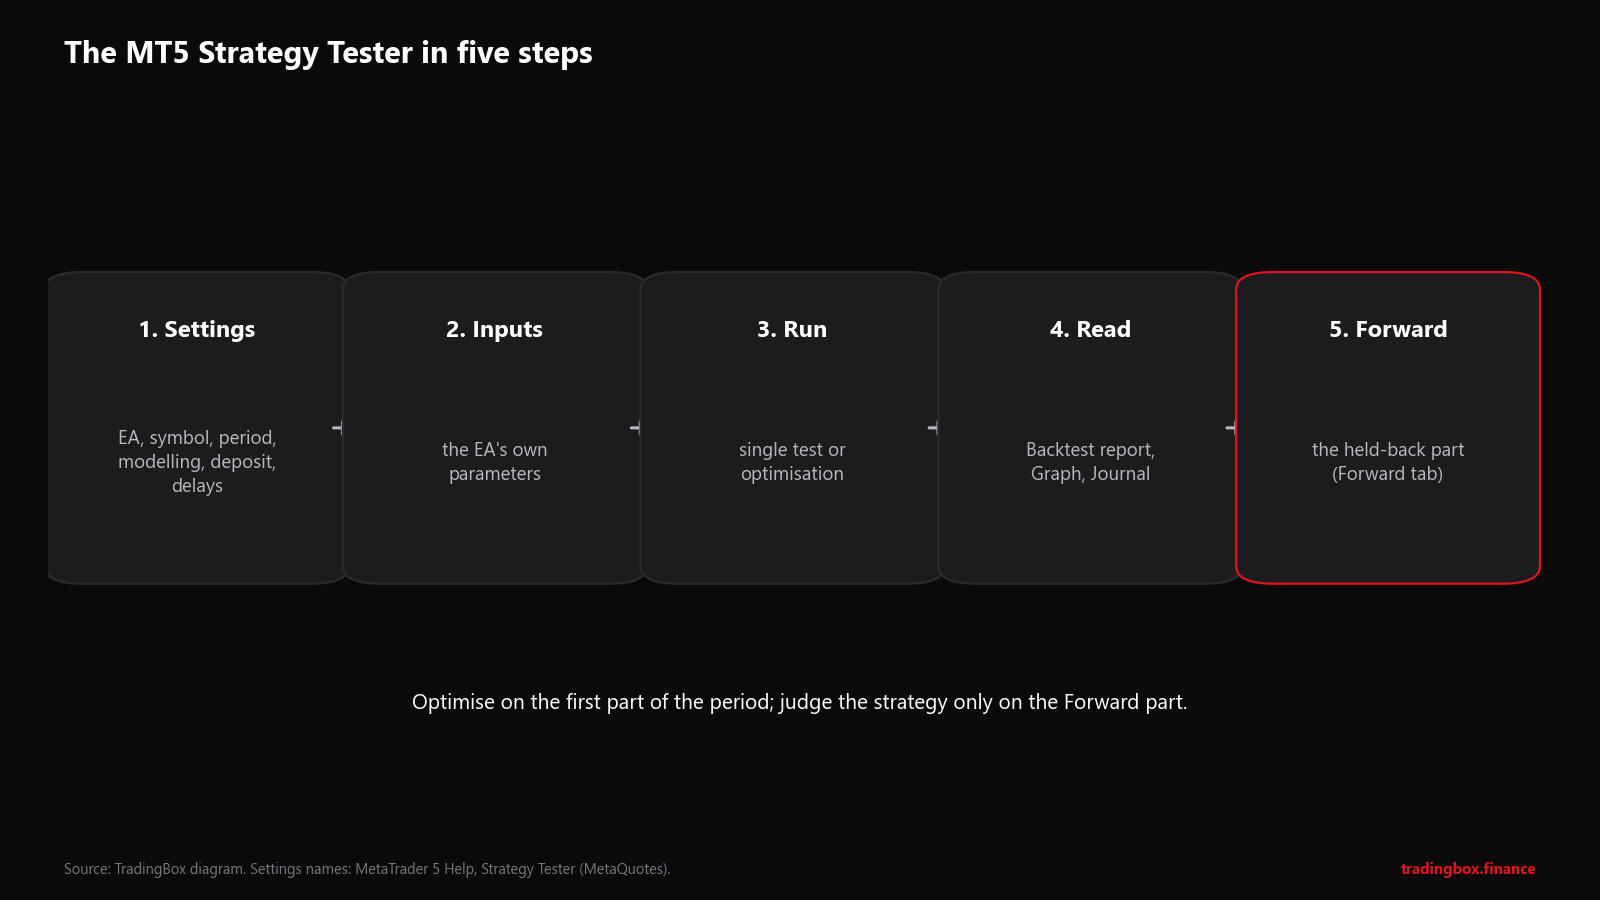
- Use the Forward setting to keep the last part of the period unseen during optimisation, and judge the EA on that part.
- In the report, look at drawdown, number of trades and the Forward results before profit.
The workflow
Step 1: Settings
| Setting | What to choose | Why |
|---|---|---|
| Expert | The EA to test | Must be in MQL5\Experts (see how to install an EA) |
| Symbol / Timeframe | What the EA was designed for | Many EAs only make sense on one timeframe |
| Date | Several years, including different market conditions | One calm year proves very little |
| Forward | 1/3 or 1/4 | Keeps the last part of the period for an out-of-sample check |
| Delays | Random delay | Simulates a real connection |
| Modelling | See the table below | Decides how realistic prices are inside each bar |
| Deposit / Leverage | Close to your real account | Margin and lot limits depend on them |
About delays. With Random delay, MetaTrader adds a delay of 0–8 seconds to 90% of the EA's trade requests and 9–18 seconds to the rest. It is deliberately pessimistic. If a strategy only works with No delay, it depends on perfect execution you will not get.
Modelling modes
| Mode | How prices are simulated | Use it for |
|---|---|---|
| Every tick based on real ticks | The broker's recorded tick history | Final checks; scalping; tight stops |
| Every tick | Ticks generated from 1-minute bars | Most everyday testing |
| 1 minute OHLC | Only open, high, low, close of each minute | Fast first runs and optimisation |
| Open prices only | Runs only at the open of each bar | EAs that only act at bar open |
| Math calculations | No prices at all | Pure calculations, not trading tests |
The common mistake: optimising on 1 minute OHLC (fast) and never re-checking on real ticks. Inside one minute the price can touch your stop before your target, and the fast mode cannot see that. A result that disappears on real ticks was never real.
Step 2: Inputs
The Inputs tab lists the EA's own settings: lot size or risk %, stop, target, indicator periods. For a single test, set the values you plan to use. For optimisation, tick the inputs to vary and set a start, step and stop for each.
Keep the number of inputs you optimise small. Every extra input multiplies the combinations and the chance of finding a setting that only worked by luck. Our backtesting article shows a real example: the best of 224 settings made +128% in its test period and +0.6% afterwards.
Step 3: Run a test or an optimisation
Single test: press Start. Tick Visualization to watch the trades on a chart; it is the best way to check that the EA does what you think it does. (Visual mode is not available during optimisation.)
Optimisation types:
| Type | What it does |
|---|---|
| Slow complete algorithm | Tests every combination. Precise, can take very long |
| Fast genetic algorithm | Searches the best combinations much faster, with results close to the complete method |
| All symbols selected in Market Watch | Runs the same inputs on every selected symbol |
The genetic algorithm ranks results by a criterion you choose: Balance max, Profit Factor max, Expected Payoff max, Drawdown min, Recovery Factor max, Sharpe Ratio max, Complex Criterion max, or Custom max (a score the EA calculates itself in OnTester()). Choosing a criterion that includes drawdown, rather than profit alone, usually gives more robust settings.
Step 4: Read the report
After a test, open the Backtest tab (the report), the Graph (balance and equity), and the Journal (errors and messages). The numbers that matter most:
| Report line | What it means | What to look for |
|---|---|---|
| History Quality | Share of correct 1-minute data | Close to 100%; low quality makes everything else doubtful |
| Total Net profit | Result of all trades | Only meaningful next to drawdown |
| Balance / Equity Drawdown Maximal | Largest fall from a peak, in money and % | Could you sit through it with real money? |
| Profit Factor | Gross profit ÷ gross loss | Above 1 is profitable; very high values with few trades often mean overfitting |
| Expected Payoff | Average result per trade | Must comfortably beat your real costs |
| Recovery Factor | Profit relative to maximum drawdown | Higher means more profit per unit of pain |
| Sharpe Ratio | Return relative to its variability | MetaTrader rates 1.0+ as good, 3.0+ very good |
| Total Trades | Number of closed trades | Under ~100, results are mostly noise |
| Maximum consecutive losses | Longest losing streak and its cost | Expect a longer one live |
Also scroll through the list of trades. Ten trades making most of the profit, trade sizes growing after losses (a martingale), or long periods with no trades all tell you more than the summary.
Step 5: The Forward results
If you set Forward to 1/3, the tester optimises on the first two thirds of your dates and then runs the chosen settings on the last third, which the optimisation never saw. Results appear on the Forward tab.
This is the most honest number the tester gives you. If the forward results collapse compared with the optimisation results, the settings were fitted to the past. If they hold up reasonably, you have a candidate worth running on a demo account.
Common mistakes
- Testing on too little history. Include trending, ranging, quiet and volatile periods.
- Zero or unrealistic spread. Use your broker's real spread, or set a fixed, slightly pessimistic one.
- Forgetting commission. Add it in the symbol settings or in the EA.
- Optimising many inputs at once and believing the best result.
- Never watching it in visual mode, and missing that the EA does something unexpected.
- Ignoring the Journal, where order errors and invalid stops are reported.
Frequently asked questions
Why are my results different from someone else's with the same EA? Different broker data, spreads, commission, modelling mode, deposit or dates. Always state all of them when comparing.
How long does a test take? From seconds (open prices, one year) to hours (real ticks, many years, full optimisation). MetaTrader can also use extra testing agents on your PC's cores or the MQL5 Cloud Network to speed up optimisation.
Can I test manual strategies in the Strategy Tester? The tester runs EAs. To practise a manual strategy on history, use visual mode with a simple trading panel EA, or a replay tool like our MT5 Candle Replay EA.
What is a good backtest result? One that survives realistic costs, real ticks, a forward period and small changes to its settings, with a drawdown you could actually live with. A big net profit alone is not a good result.
Next steps
- New to EAs? Start with What Is an Expert Advisor in MT5?
- Learn the platform, including the Strategy Tester, in our free MetaTrader 5 Interface course (coming soon: press Notify me).
- Want your strategy coded as an EA so you can test it properly? See custom EA development.
Sources
- MetaQuotes, MetaTrader 5 Help: Strategy Tester (modelling, delays, forward testing, visual mode), Optimization types and Testing report.
This article is education, not financial advice. Backtested results have well-known limitations and do not guarantee future results.
Trading involves risk. See the risk disclaimer.